Insights into the investment path charted for Blue Point clients.

January 18, 2026
During the fourth quarter, Blue Point's model portfolio, applied to separately managed accounts, returned 2.80% net-of-fees. The Total Return of the S&P 500, which includes dividends, was 2.65%.
November 19, 2025
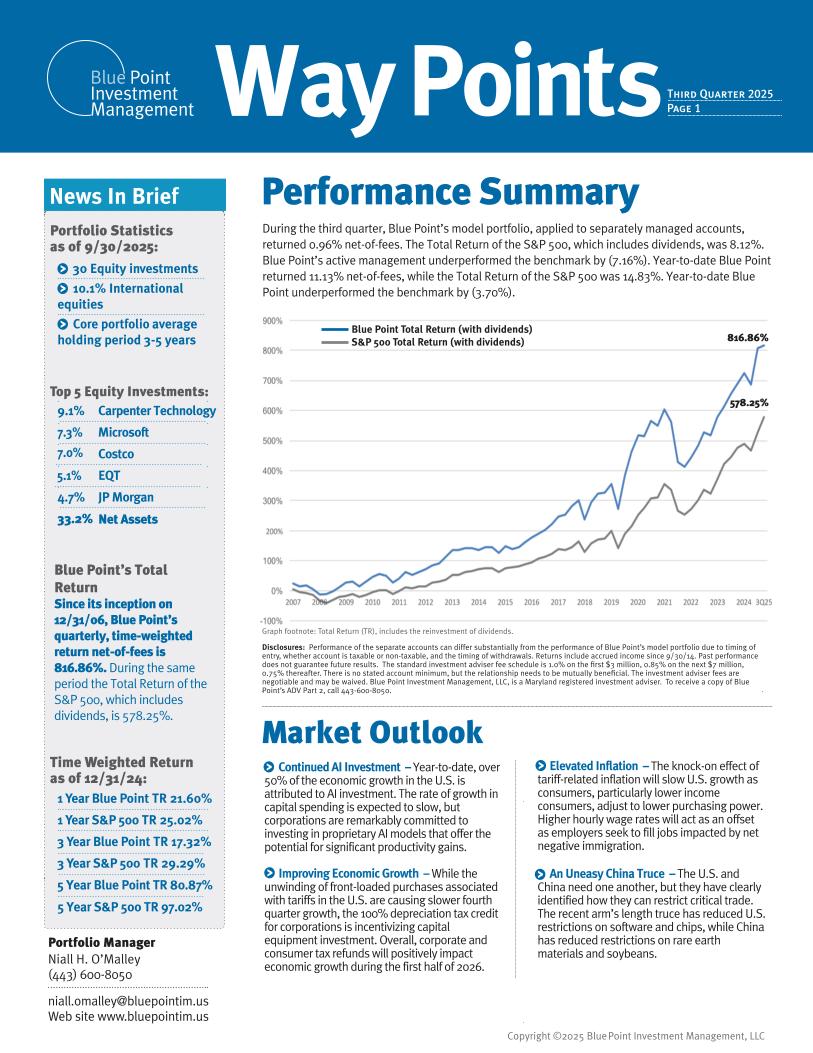
During the third quarter, Blue Point’s model portfolio, applied to separately managed accounts, returned 0.96% net-of-fees. The Total Return of the S&P 500, which includes dividends, was 8.12%.
August 27, 2025
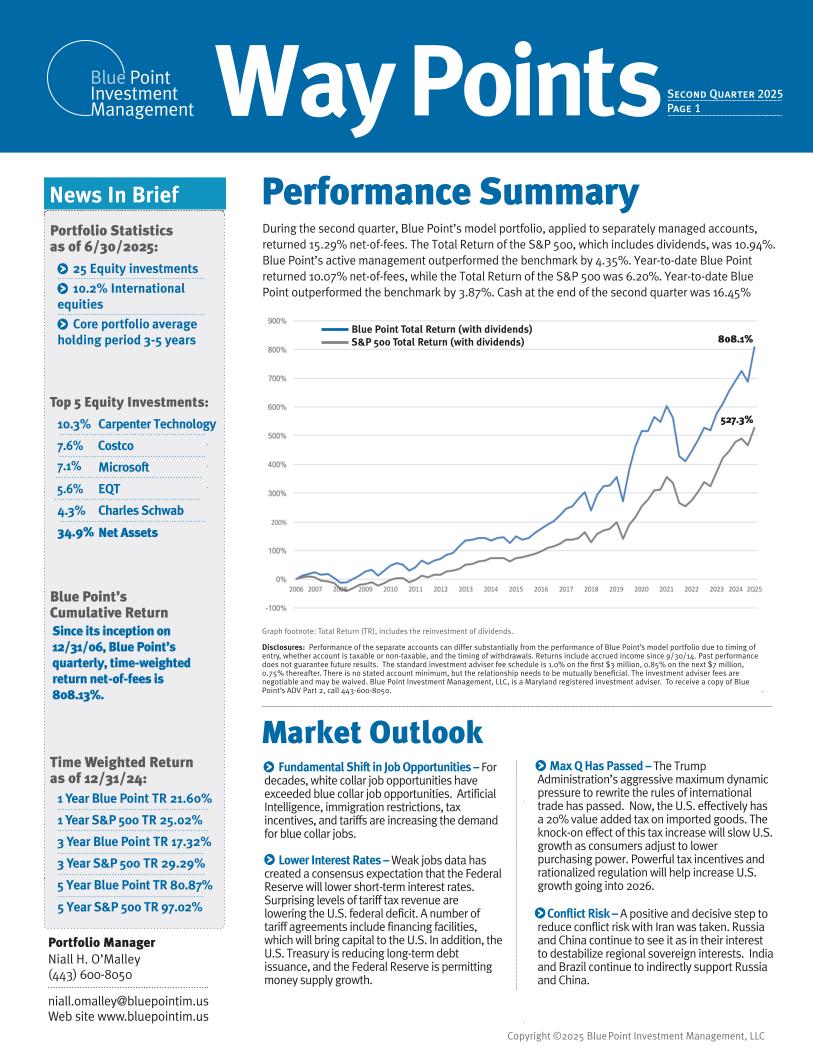
During the second quarter, Blue Point's model portfolio, applied to separately managed accounts, returned 15.29% net-of-fees. The Total Return of the S&P 500, which includes dividends, was 10.94%.
June 2, 2025
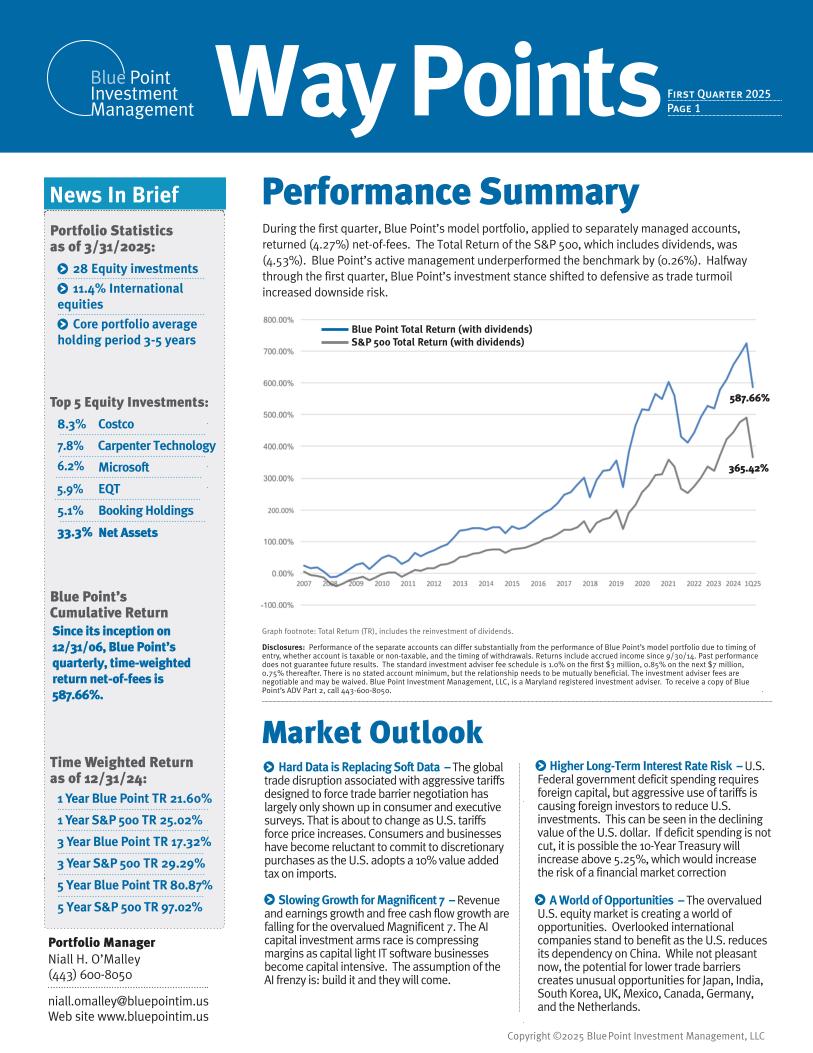
During the first quarter, Blue Point's model portfolio, applied to separately managed accounts, returned (4.27%) net-of-fees. The Total Return of the S&P 500, which includes dividends, was (4.53%).
January 22, 2025
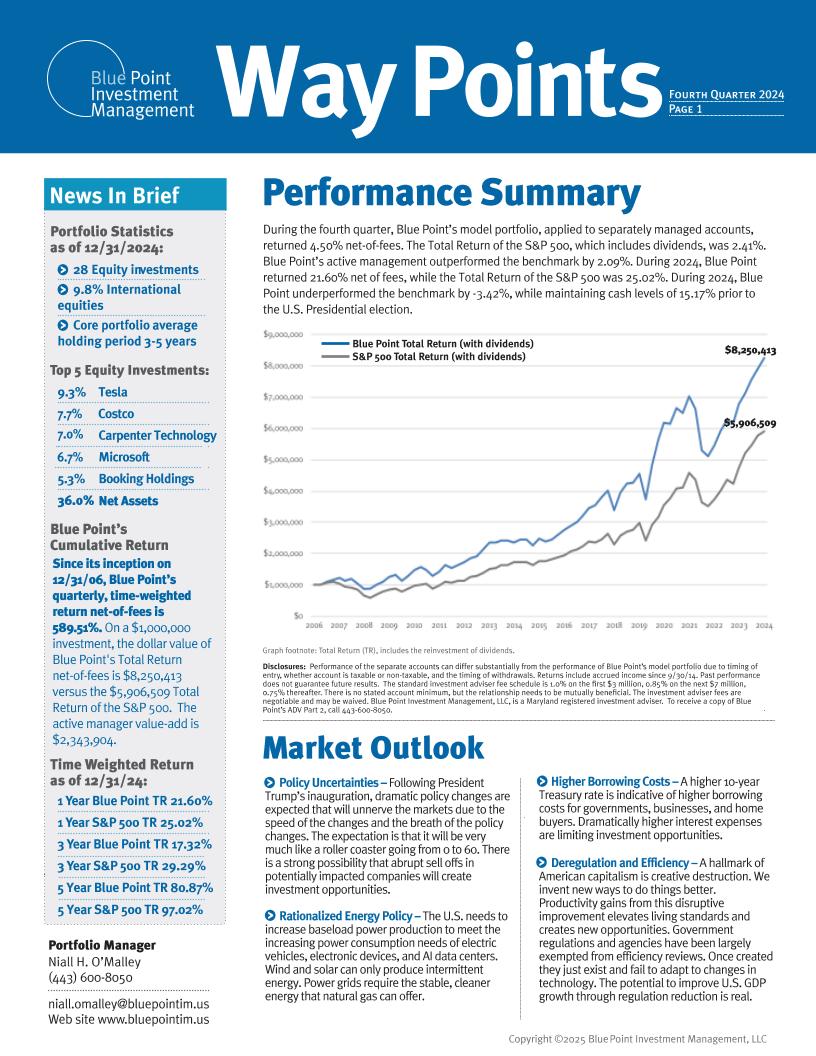
During the fourth quarter, Blue Point’s model portfolio, applied to separately managed accounts, returned 4.50% net-of-fees. The Total Return of the S&P 500, which includes dividends, was 2.41%.

November 20, 2024
During the third quarter, Blue Point’s model portfolio, applied to separately managed accounts returned 4.43% net-of-fees. The Total Return of the S&P 500, which includes dividends, was 5.89%.
August 28, 2024
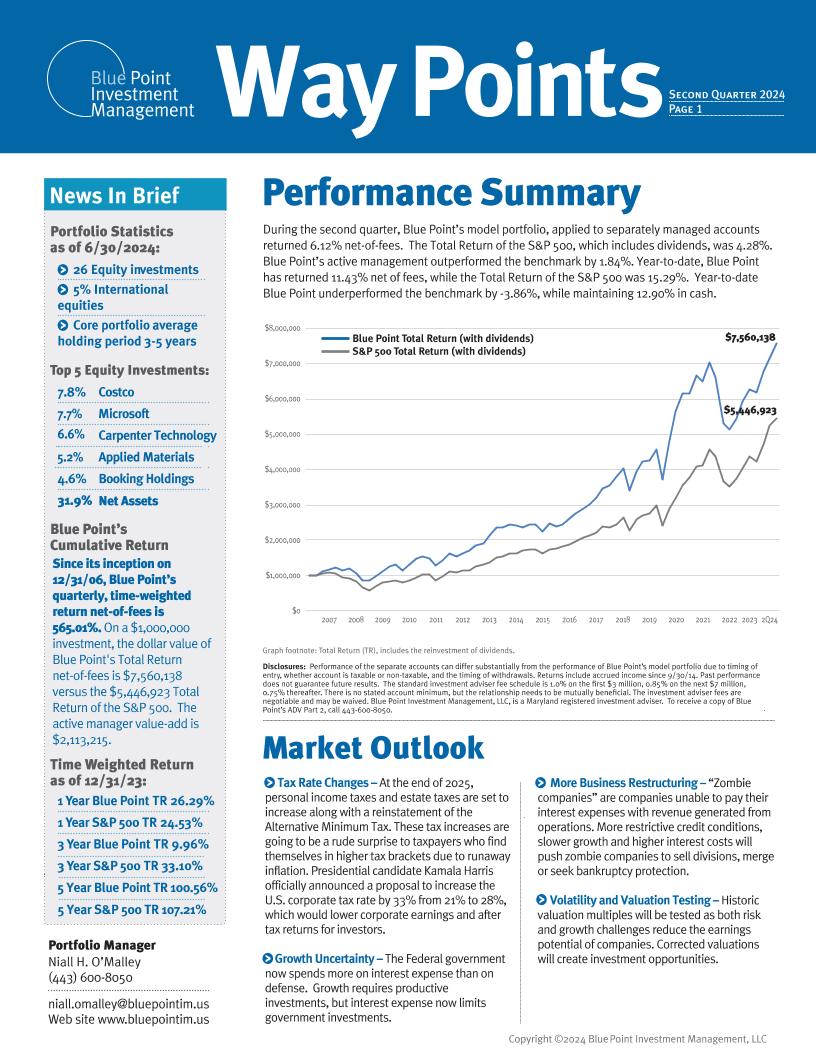
During the second quarter, Blue Point’s model portfolio, applied to separately managed accounts returned 6.12% net-of-fees. The Total Return of the S&P 500, which includes dividends, was 4.28%.
May 27, 2024
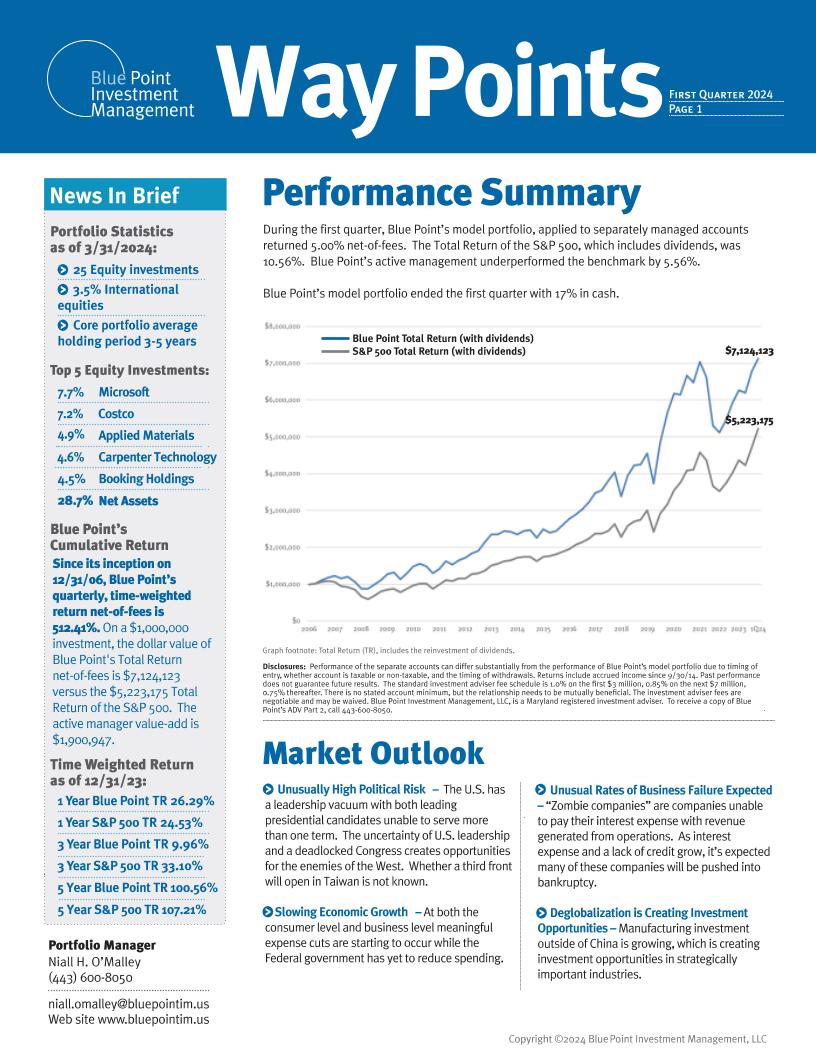
During the first quarter, Blue Point’s model portfolio, applied to separately managed accounts returned 5.00% net-of-fees. The Total Return of the S&P 500, which includes dividends, was 10.56%.

February 22, 2024
During the fourth quarter, Blue Point’s model portfolio, applied to separately managed accounts returned 9.63% net-of-fees. The Total Return of the S&P 500, which includes dividends, was 11.69%.
November 13, 2023
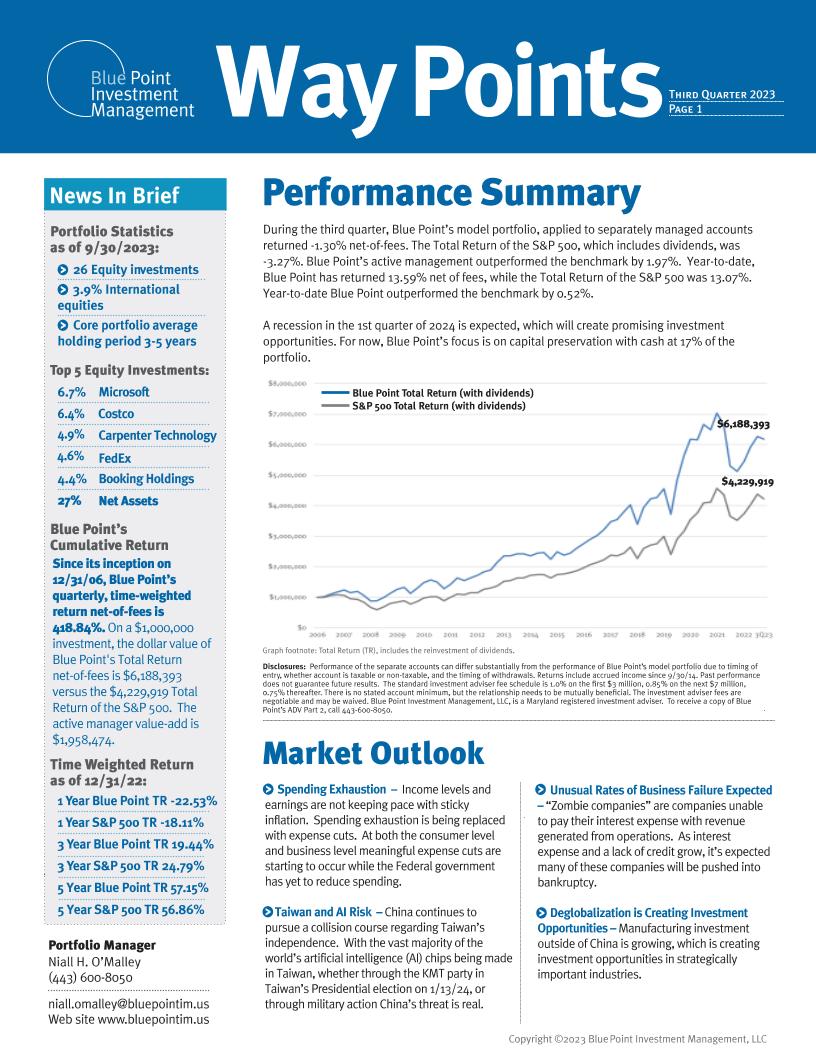
During the third quarter, Blue Point’s model portfolio, applied to separately managed accounts returned -1.30% net-of-fees. The Total Return of the S&P 500, which includes dividends, was -3.27%.
August 21, 2023
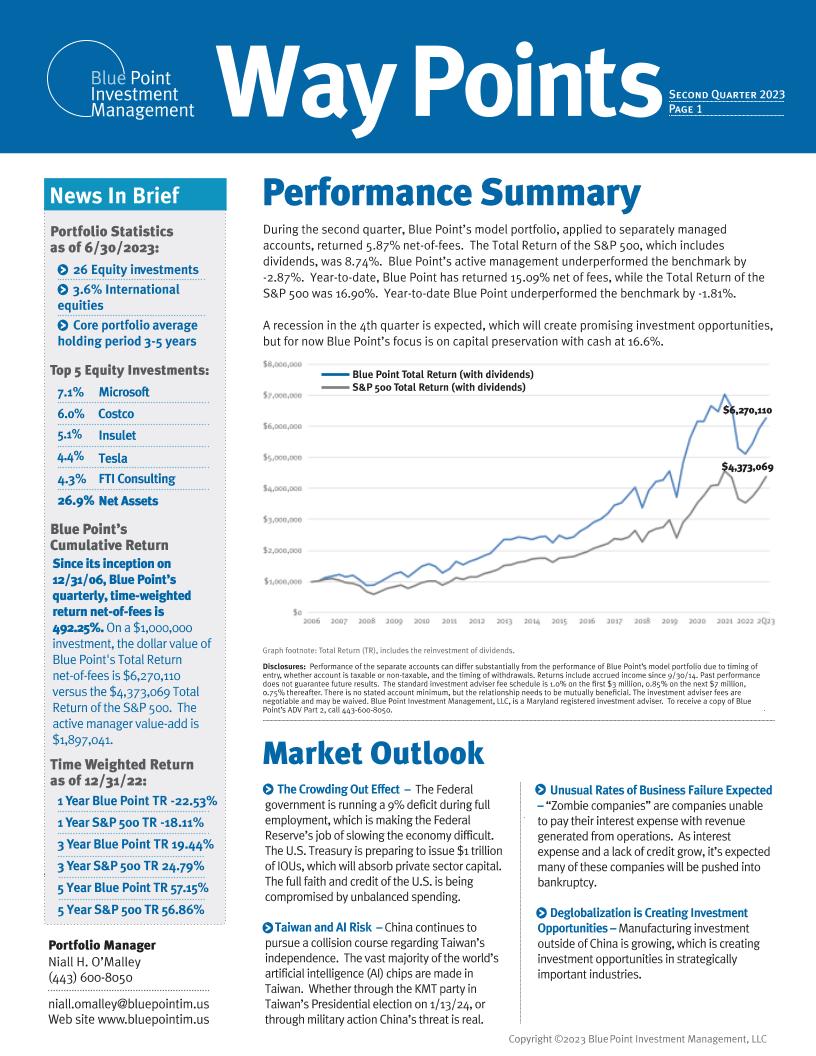
During the second quarter, Blue Point’s model portfolio, applied to separately managed accounts, returned 5.87% net-of-fees. The Total Return of the S&P 500, which includes dividends, was 8.74%.

June 1, 2023
During the first quarter, Blue Point’s model portfolio, applied to separately managed accounts, returned 8.71% net-of-fees. The Total Return of the S&P 500, which includes dividends, was 7.50%.
February 21, 2023
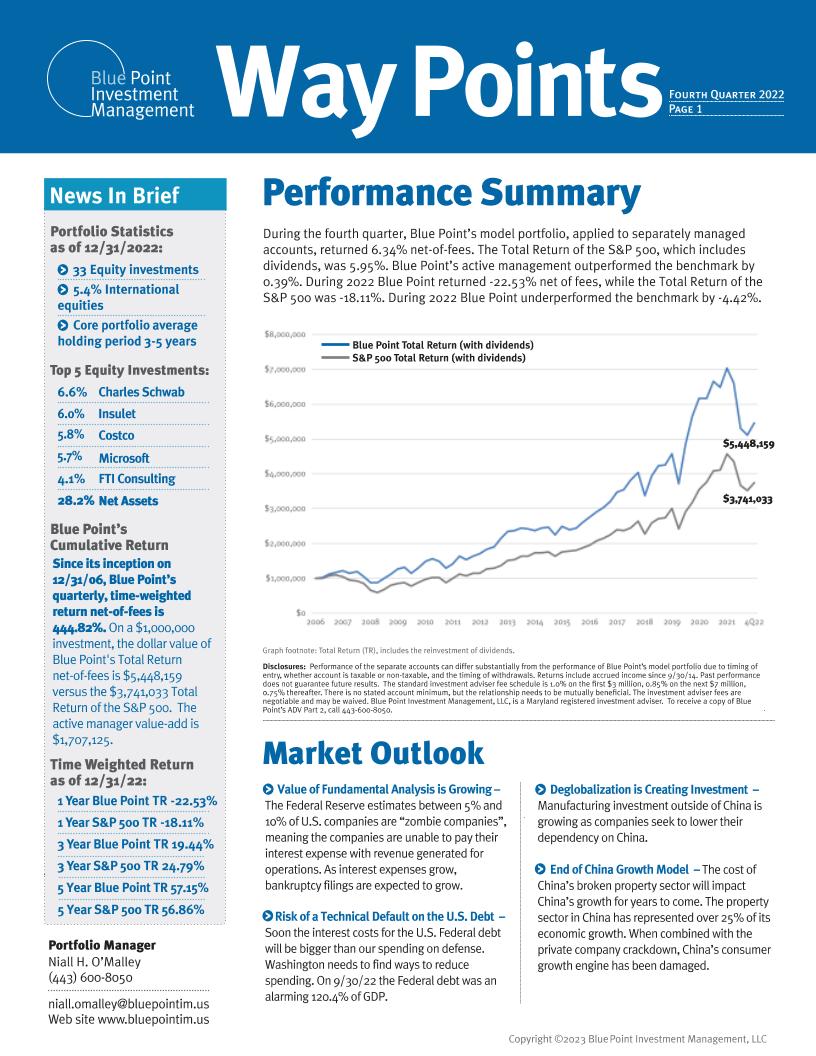
During the fourth quarter, Blue Point’s model portfolio, applied to separately managed accounts, returned 6.34% net-of-fees. The Total Return of the S&P 500, which includes dividends, was 5.95%.
November 16, 2022
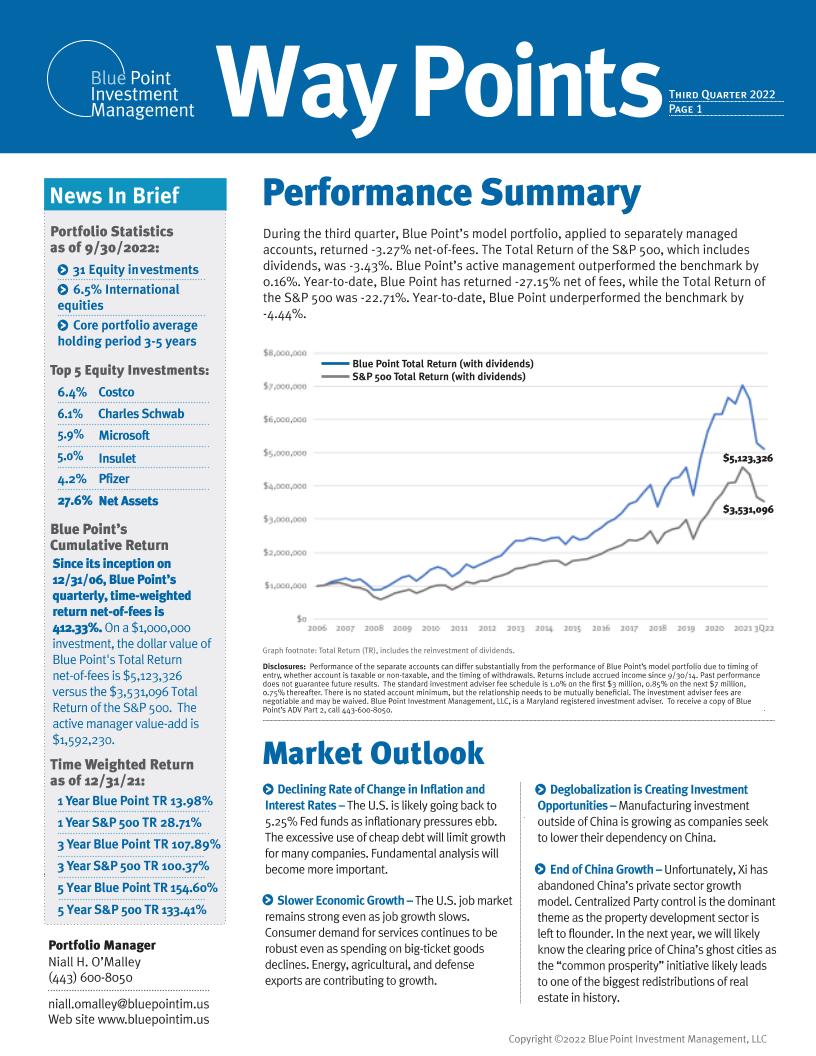
During the third quarter, Blue Point’s model portfolio, applied to separately managed accounts, returned -3.27% net-of-fees. The Total Return of the S&P 500, which includes dividends, was -3.43%.
August 25, 2022
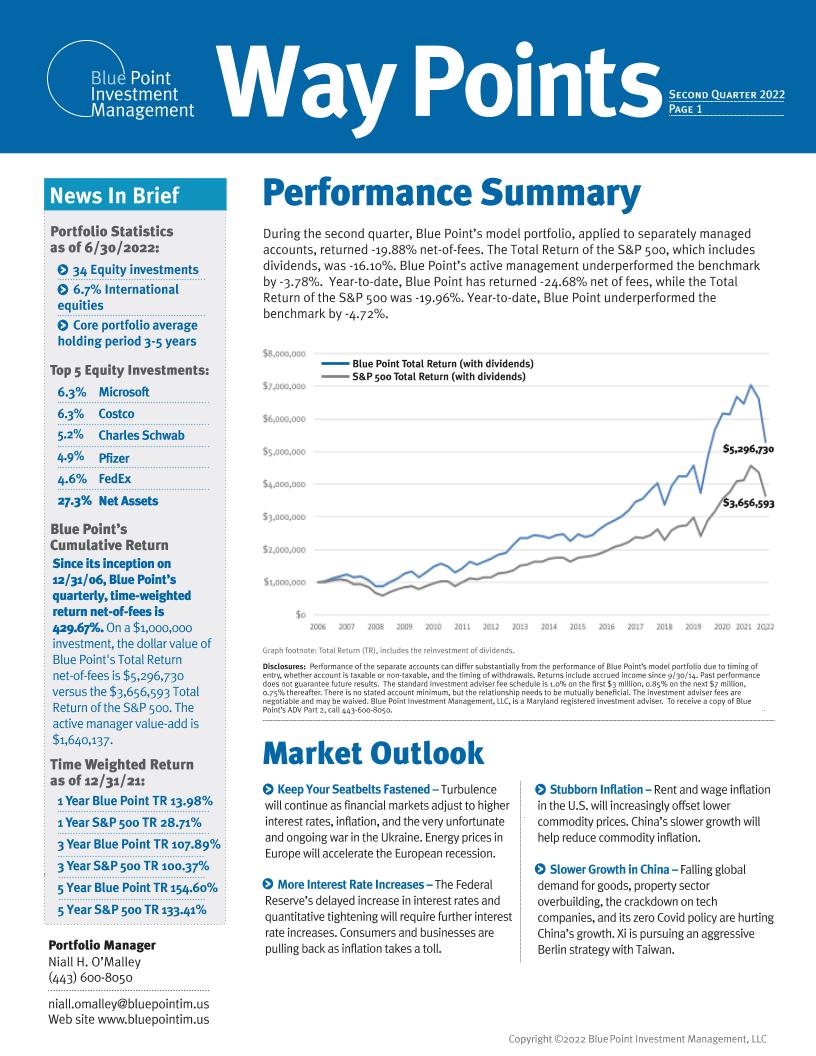
During the second quarter, Blue Point’s model portfolio, applied to separately managed accounts, returned -19.88% net-of-fees. The Total Return of the S&P 500, which includes dividends, was -16.10%.
May 10, 2022
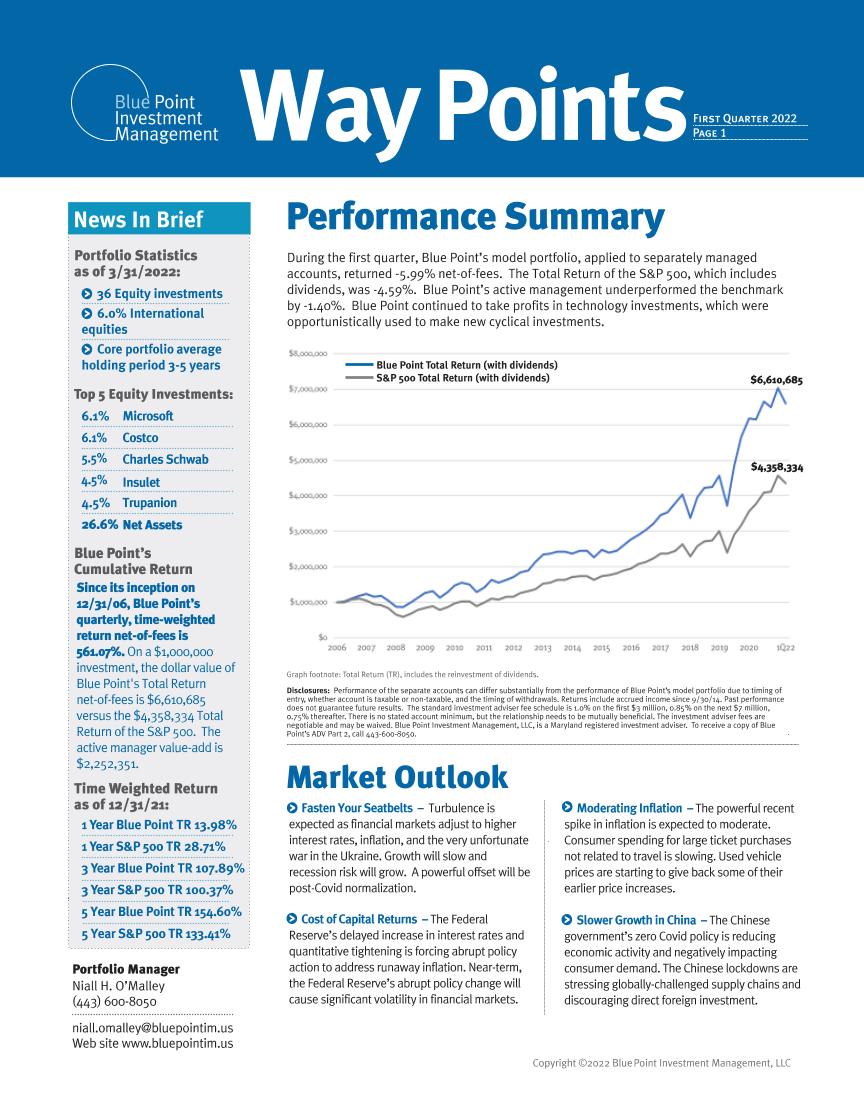
During the first quarter, Blue Point’s model portfolio, applied to separately managed accounts, returned -5.99% net-of-fees. The Total Return of the S&P 500, which includes dividends, was -4.59%.
February 18, 2022
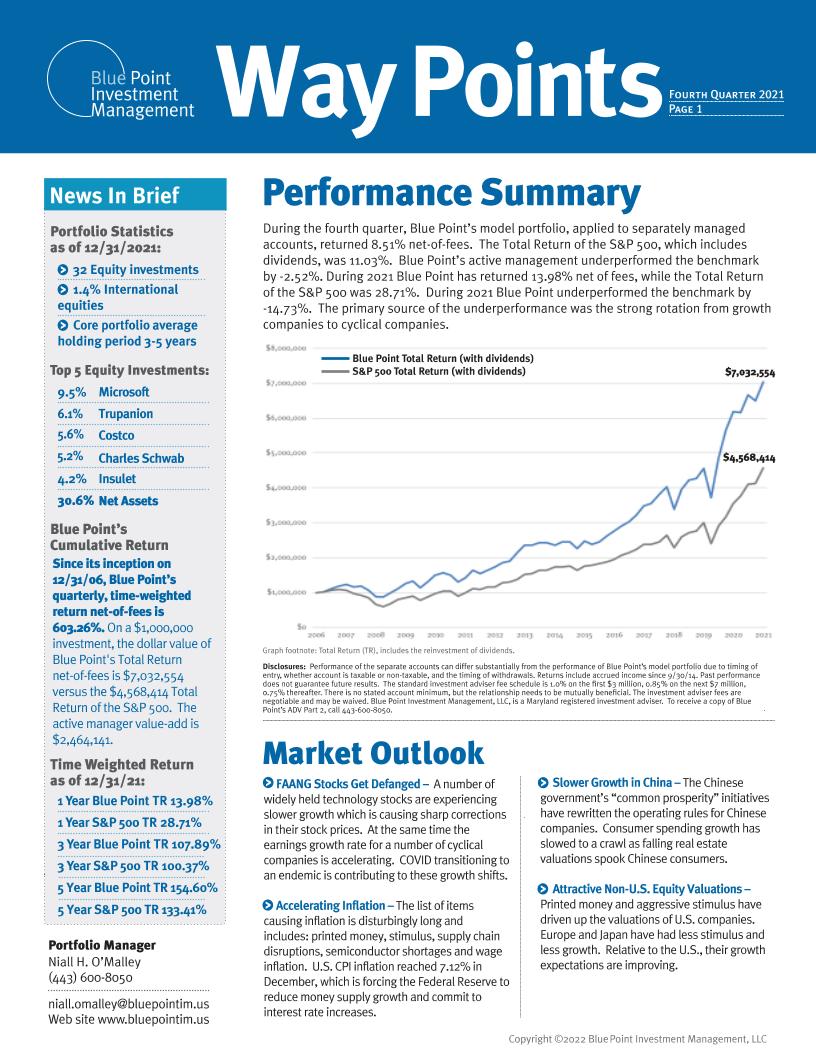
During the fourth quarter, Blue Point’s model portfolio, applied to separately managed accounts, returned 8.51% net-of-fees. The Total Return of the S&P 500, which includes
dividends, was 11.03%.

November 16, 2021
During the third quarter, Blue Point’s model portfolio, applied to separately managed accounts, returned -2.74% net-of-fees. The Total Return of the S&P 500, which includes dividends, was 0.58%.
August 12, 2021
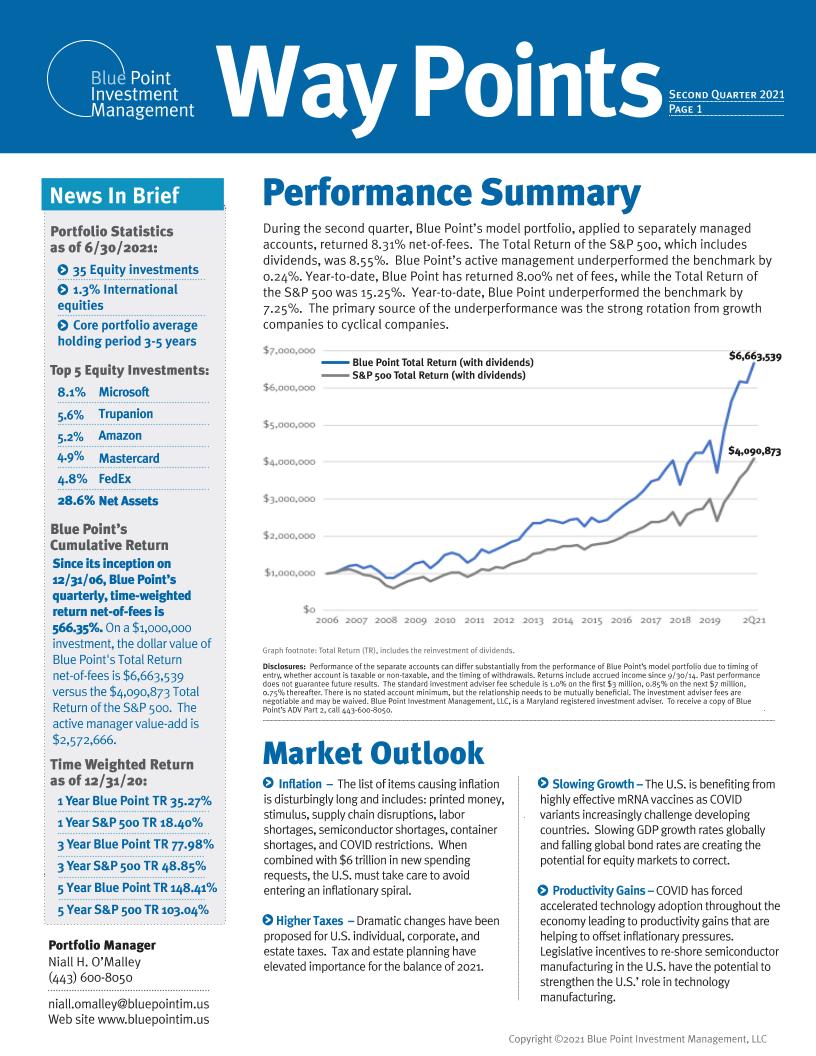
During the second quarter, Blue Point’s model portfolio, applied to separately managed accounts, returned 8.31% net-of-fees. The Total Return of the S&P 500, which includes dividends, was 8.55%.
May 19, 2021
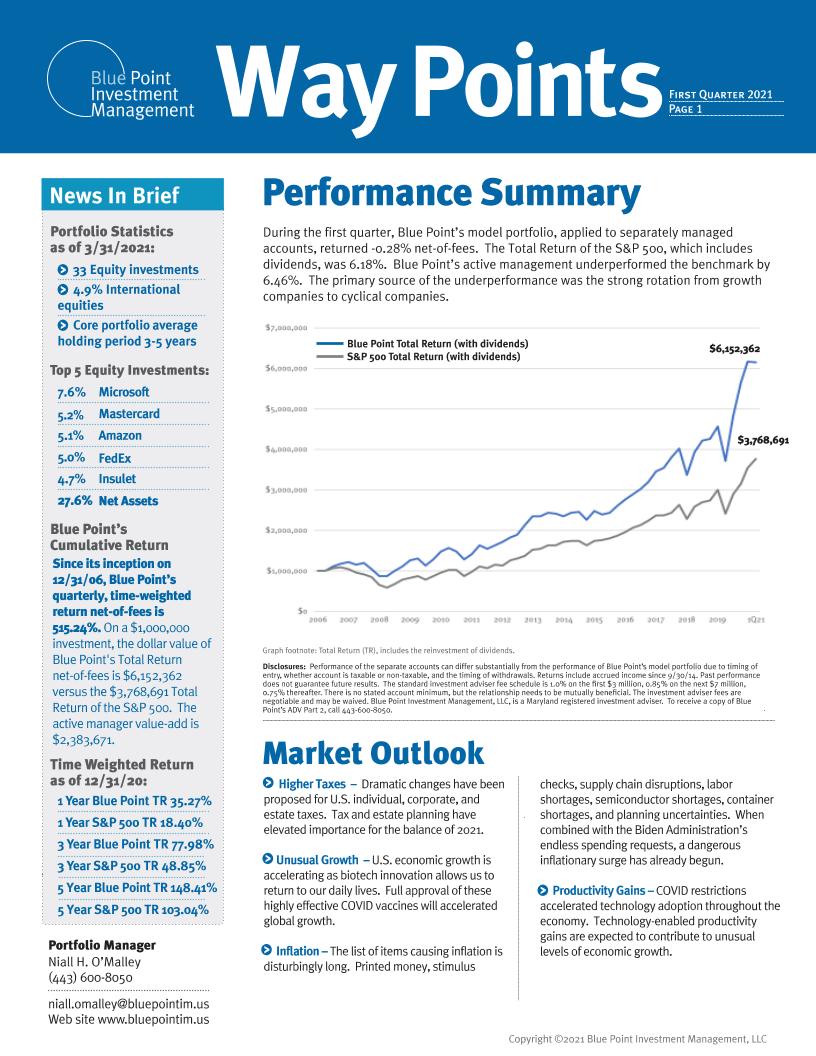
During the first quarter, Blue Point’s model portfolio, applied to separately managed accounts, returned -0.28% net-of-fees.
February 12, 2021
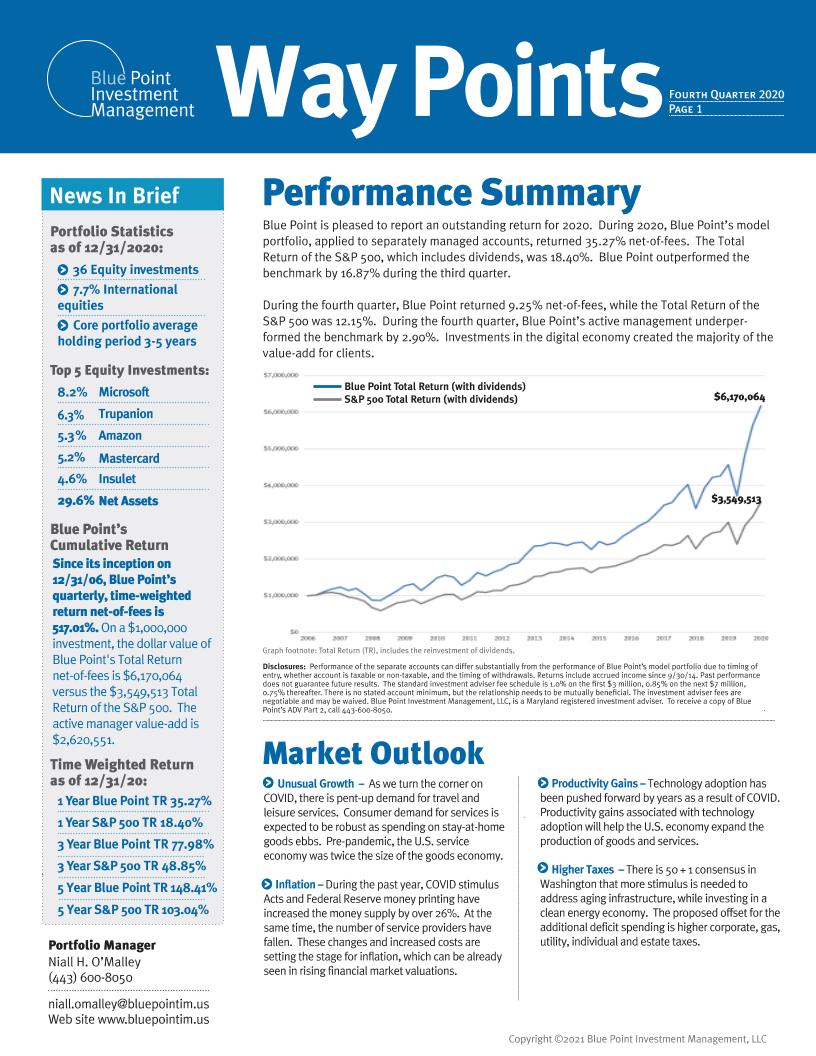
Blue Point is pleased to report an outstanding return for 2020. During 2020, Blue Point’s model portfolio, applied to separately managed accounts, returned 35.27% net-of-fees.

October 21, 2020
Blue Point is pleased to report an outstanding performance for the third quarter. During the third quarter, Blue Point’s model portfolio, applied to separately managed accounts, returned 16.92% net-of-fees.

August 13, 2020
Blue Point is pleased to report exceptional performance for the second quarter. The dislocation in the financial markets created opportunities to make new investments in the digital economy.
May 1, 2020
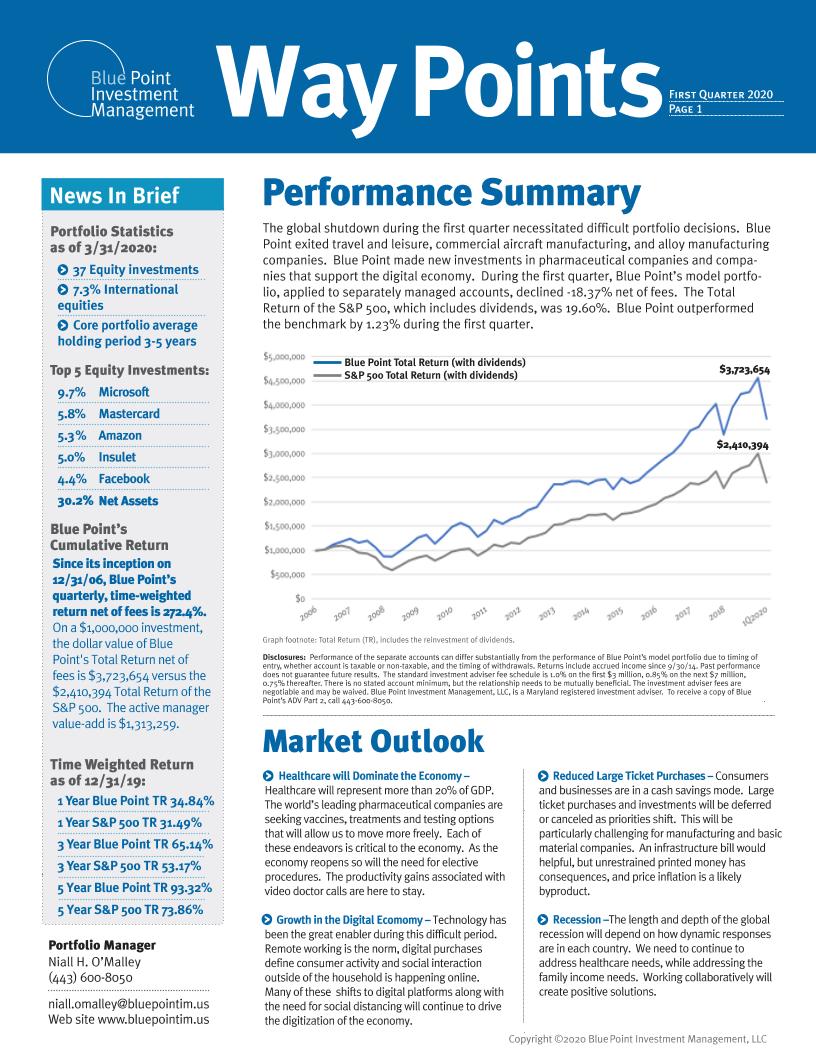
The global shutdown during the first quarter necessitated difficult portfolio decisions. Blue Point exited travel and leisure, commercial aircraft manufacturing, and alloy manufacturing companies.
February 13, 2020
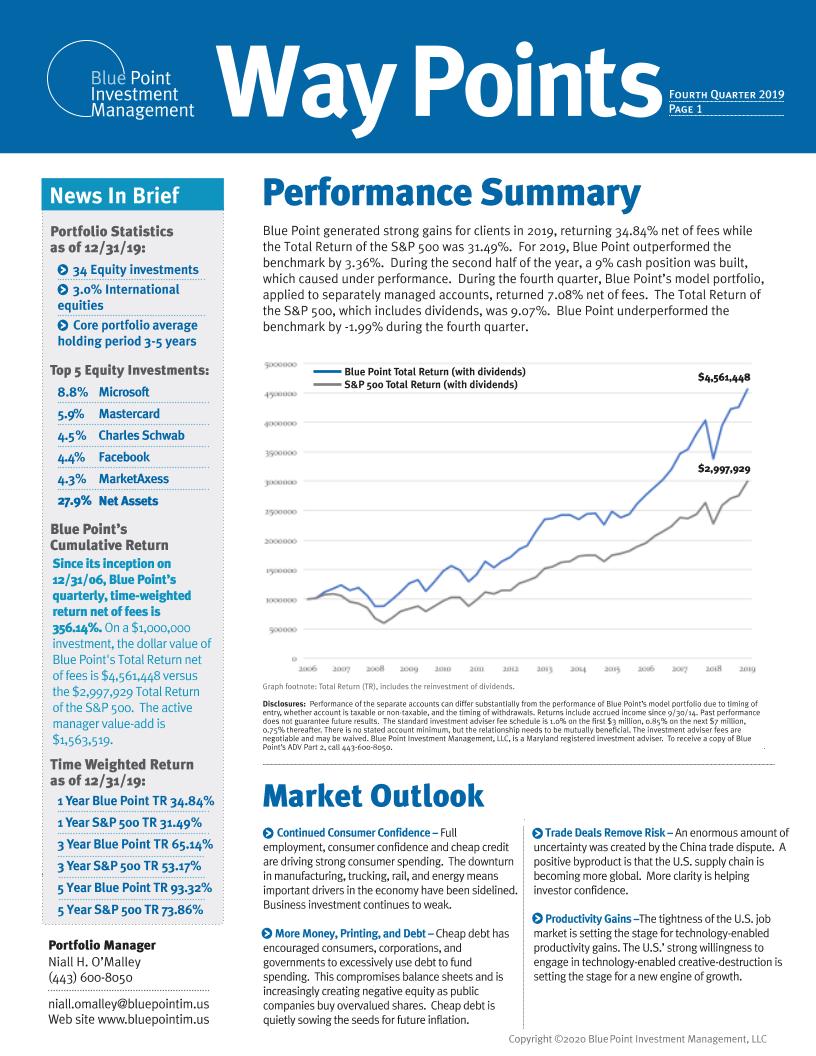
Blue Point generated strong gains for clients in 2019, returning 34.84% net of fees while the Total Return of the S&P 500 was 31.49%. For 2019, Blue Point outperformed the benchmark by 3.36%.
November 12, 2019
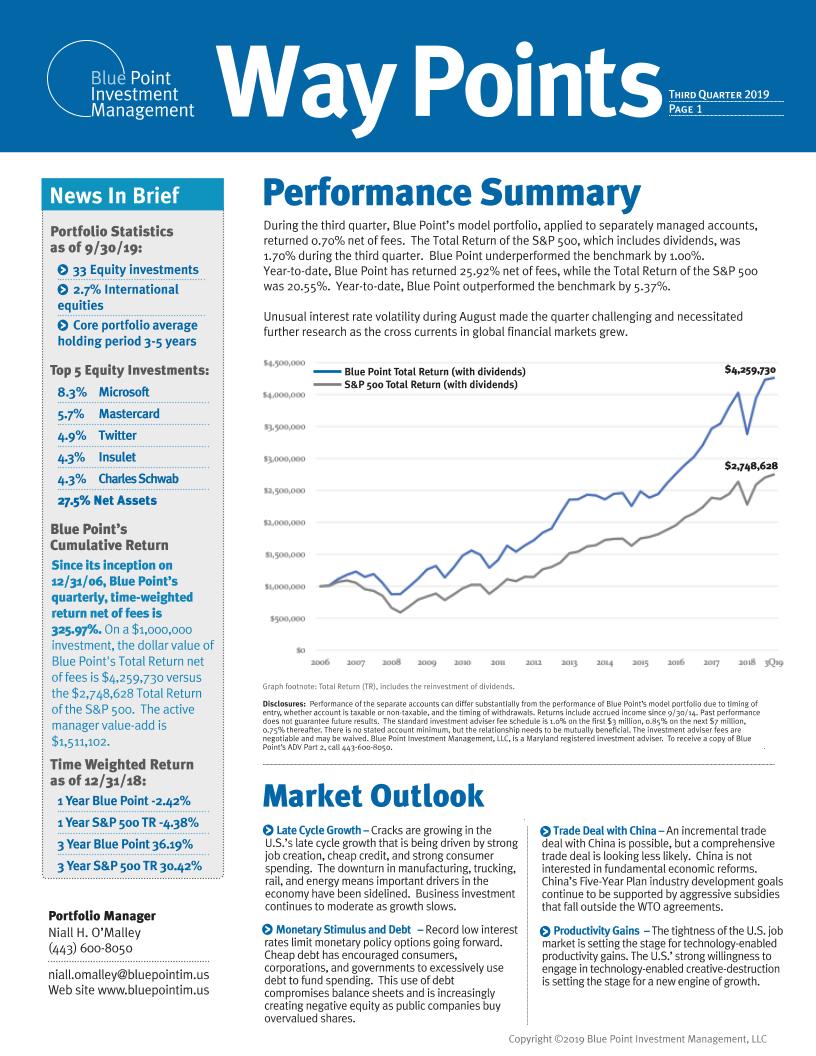
During the third quarter, Blue Point’s model portfolio, applied to separately managed accounts, returned 0.70% net of fees.

July 19, 2019
During the second quarter, Blue Point’s model portfolio, applied to separately managed accounts, returned 7.25% net of fees. The Total Return of the S&P 500, which includes dividends, was 4.30% during the second quarter. Blue Point outperformed the benchmark by 2.95%.
May 9, 2019
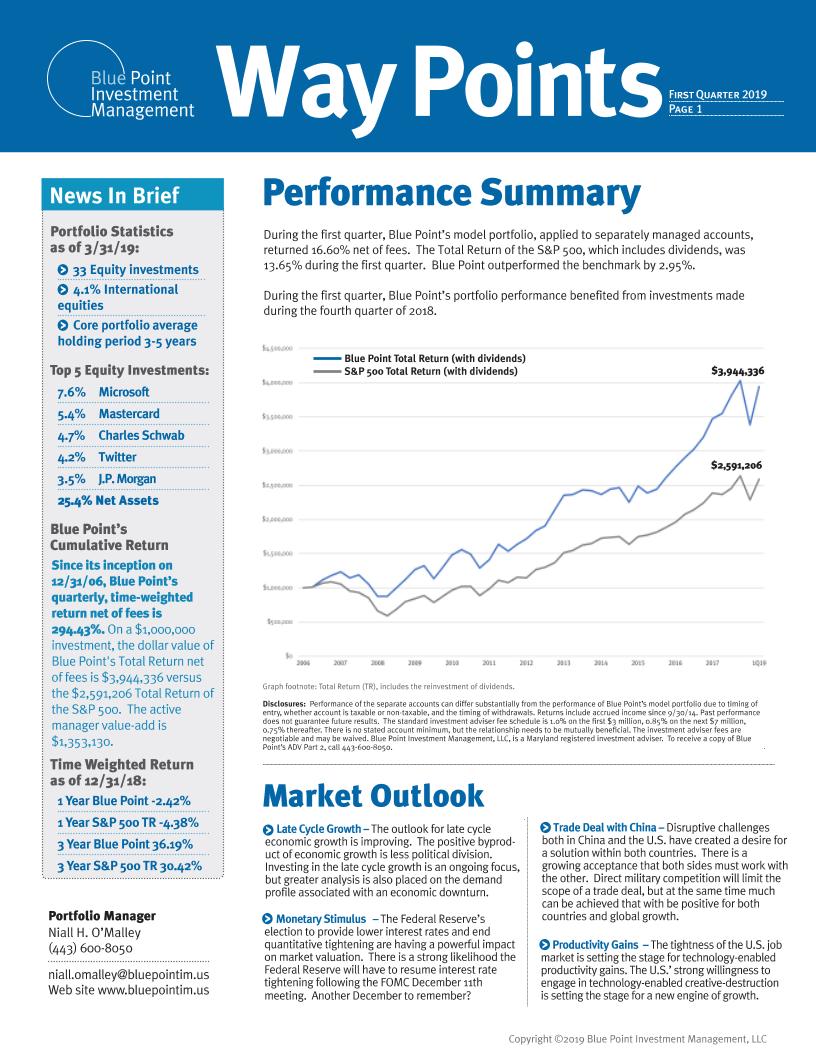
During the first quarter, Blue Point’s model portfolio, applied to separately managed accounts, returned 16.60% net of fees. The Total Return of the S&P 500, which includes dividends, was 13.65% during the first quarter. Blue Point outperformed the benchmark by 2.95%.
January 8, 2019
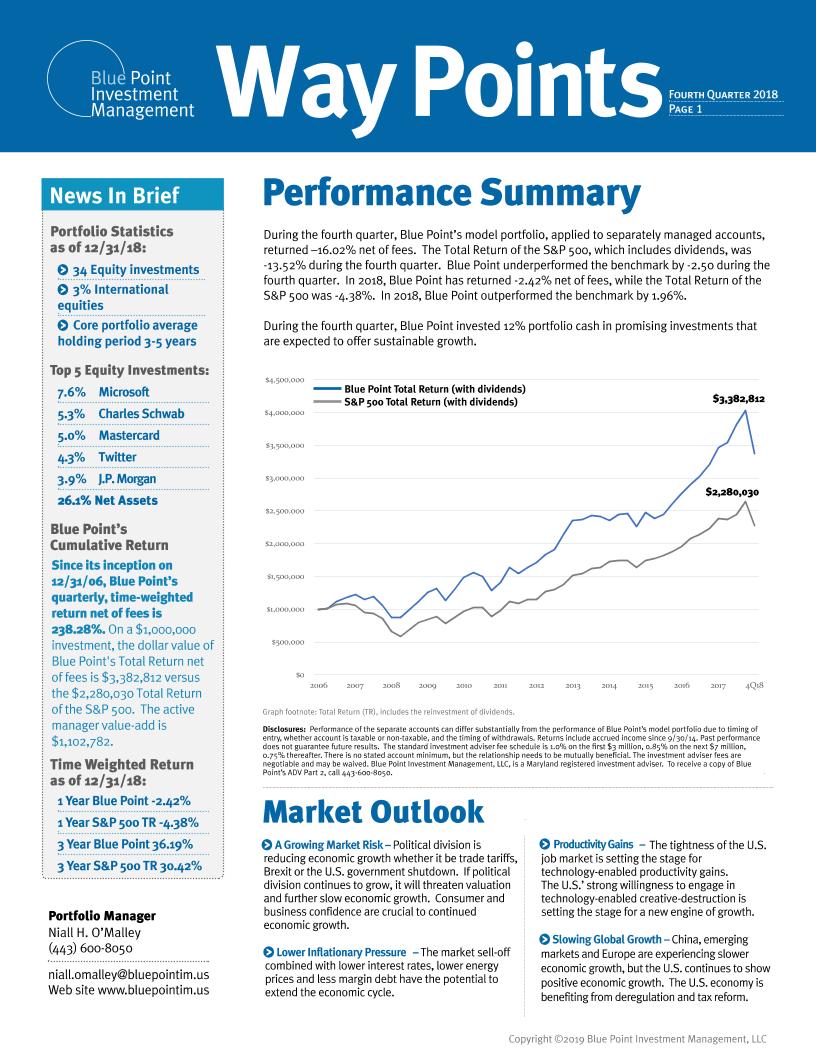
During the fourth quarter, Blue Point’s model portfolio, applied to separately managed accounts, returned –16.02% net of fees. The Total Return of the S&P 500, which includes dividends, was -13.52% during the fourth quarter.
November 4, 2018
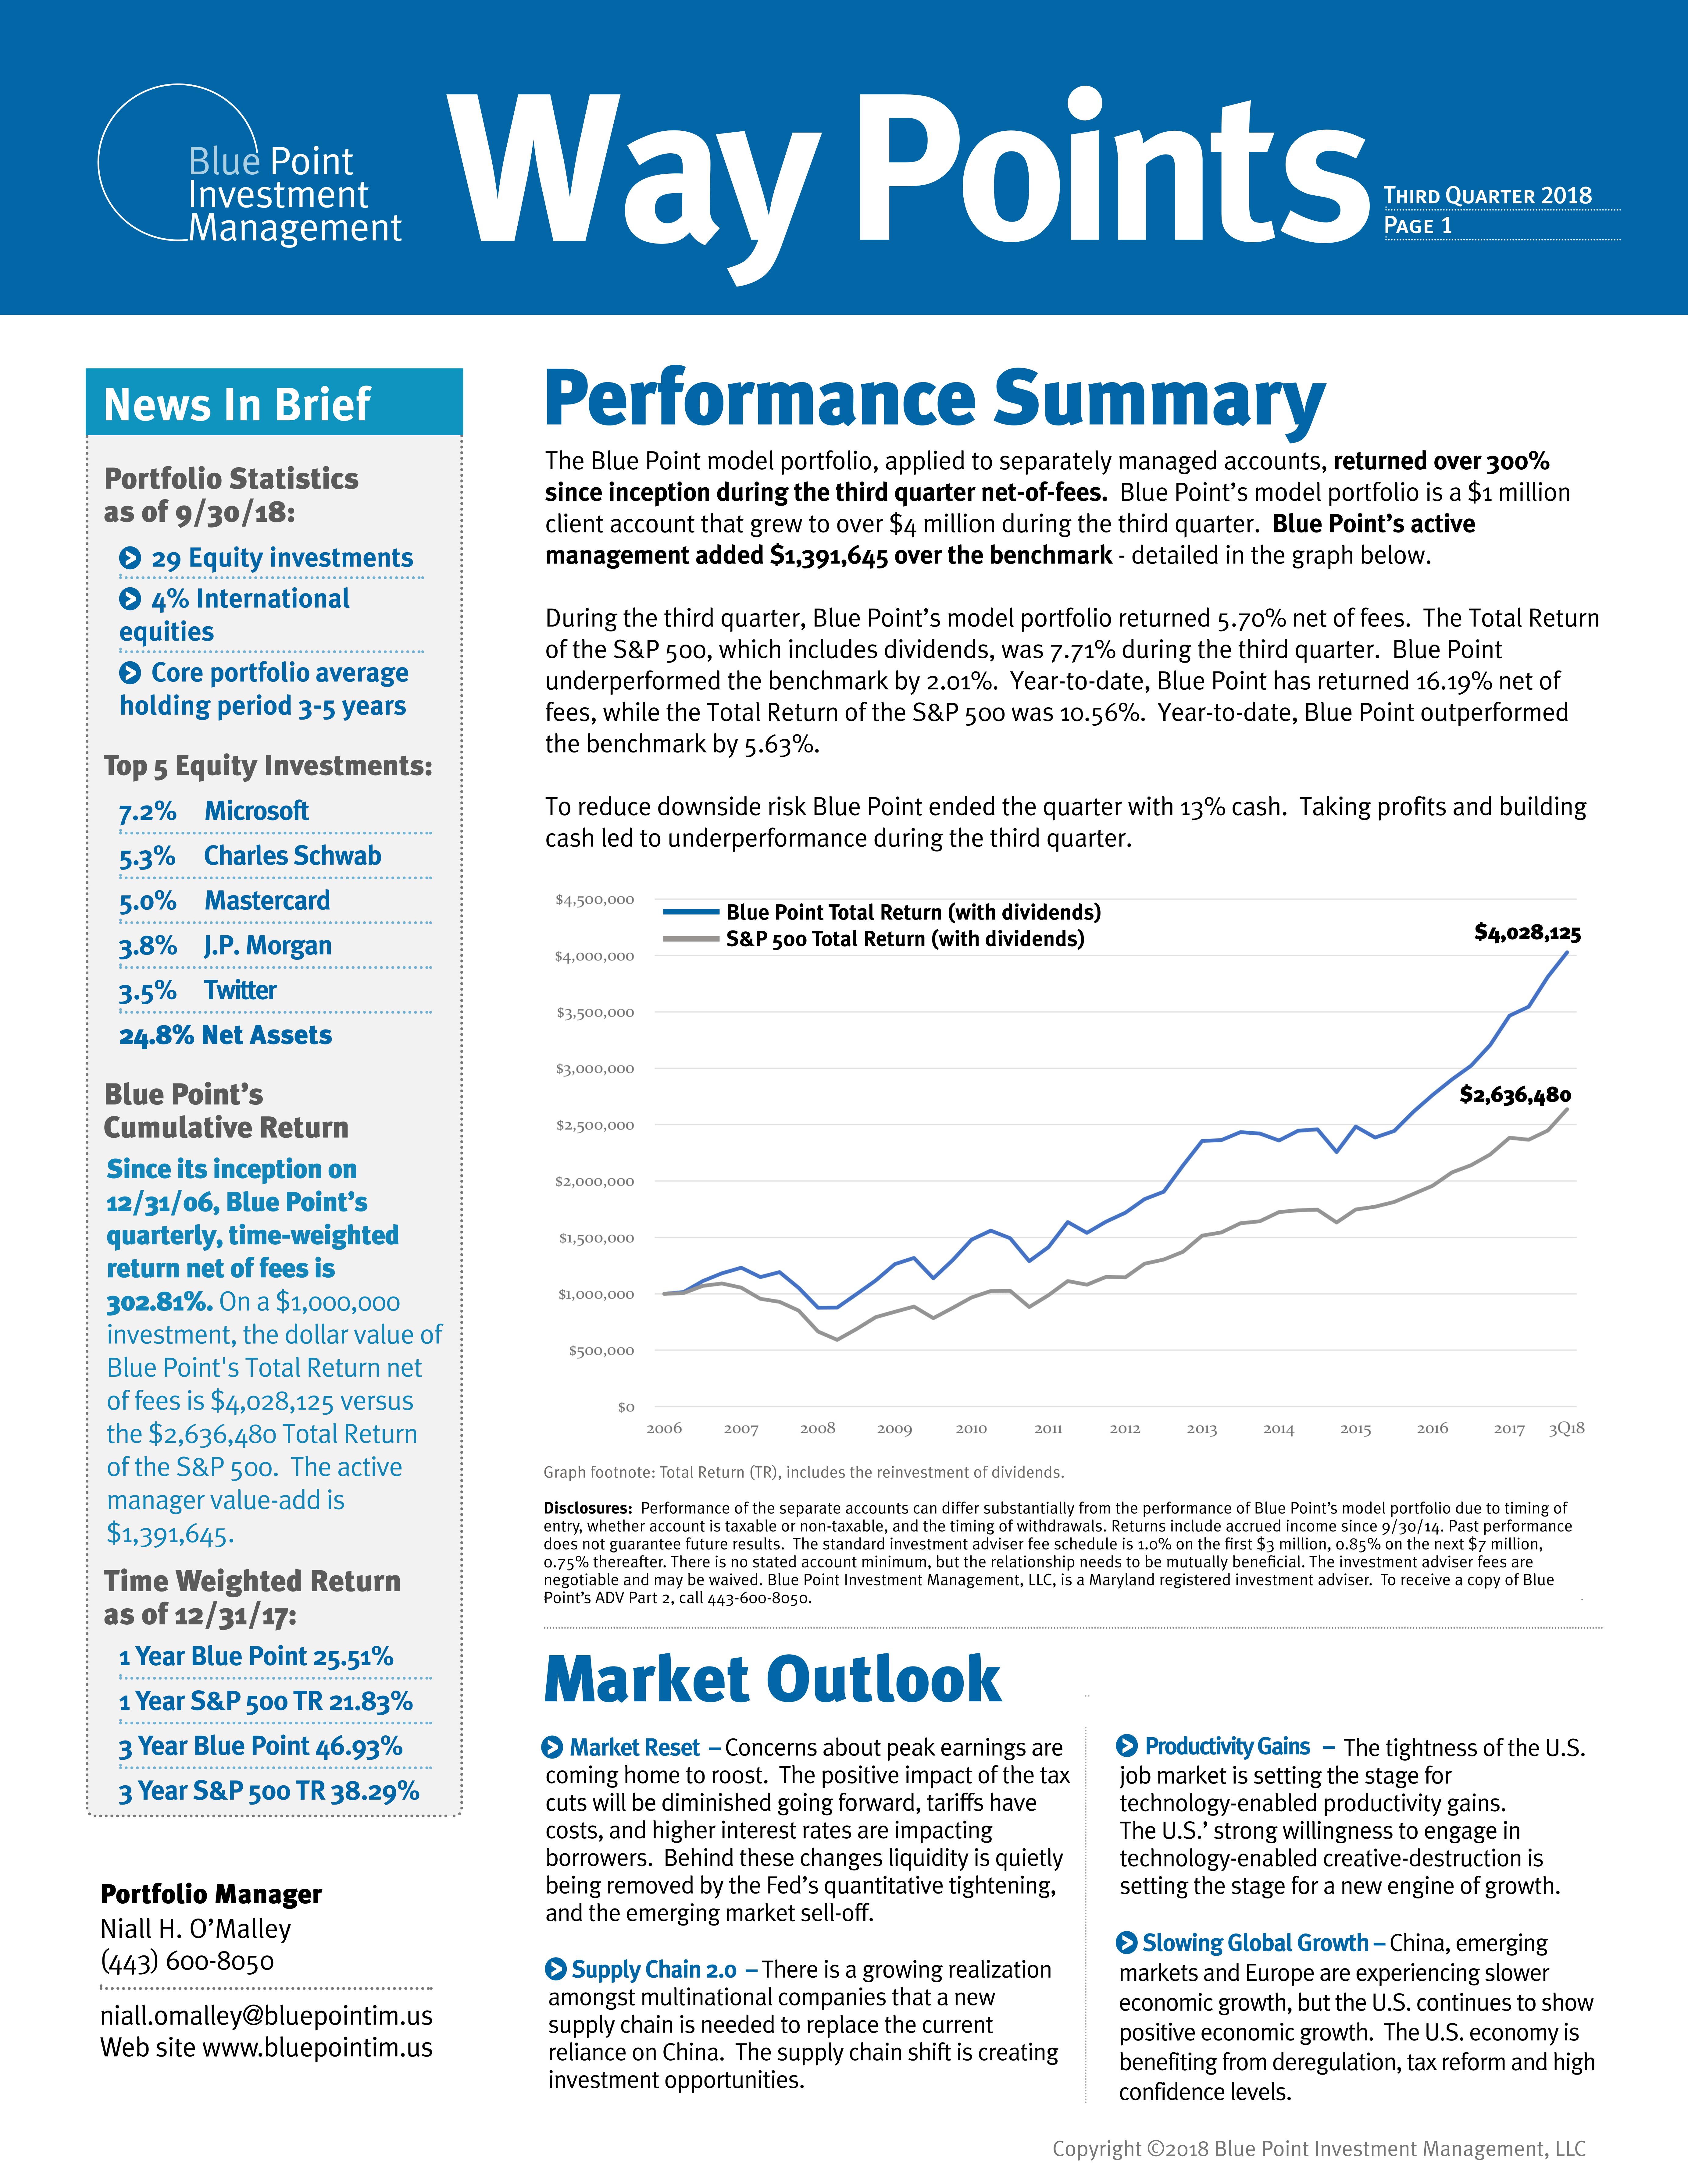
During the third quarter, Blue Point’s model portfolio returned 5.70% net of fees. The Total Return of the S&P 500, which includes dividends, was 7.71% during the third quarter.
July 11, 2018
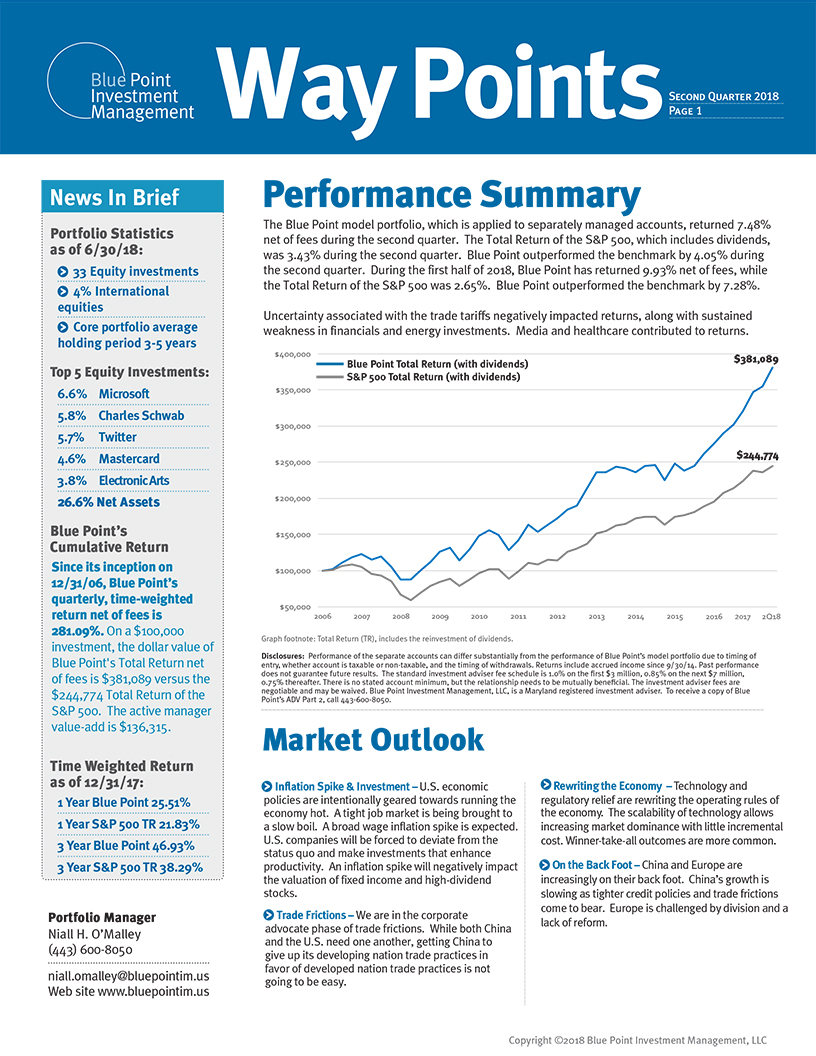
The Blue Point model portfolio, which is applied to separately managed accounts, returned 7.48% net of fees during the second quarter.
March 31, 2018
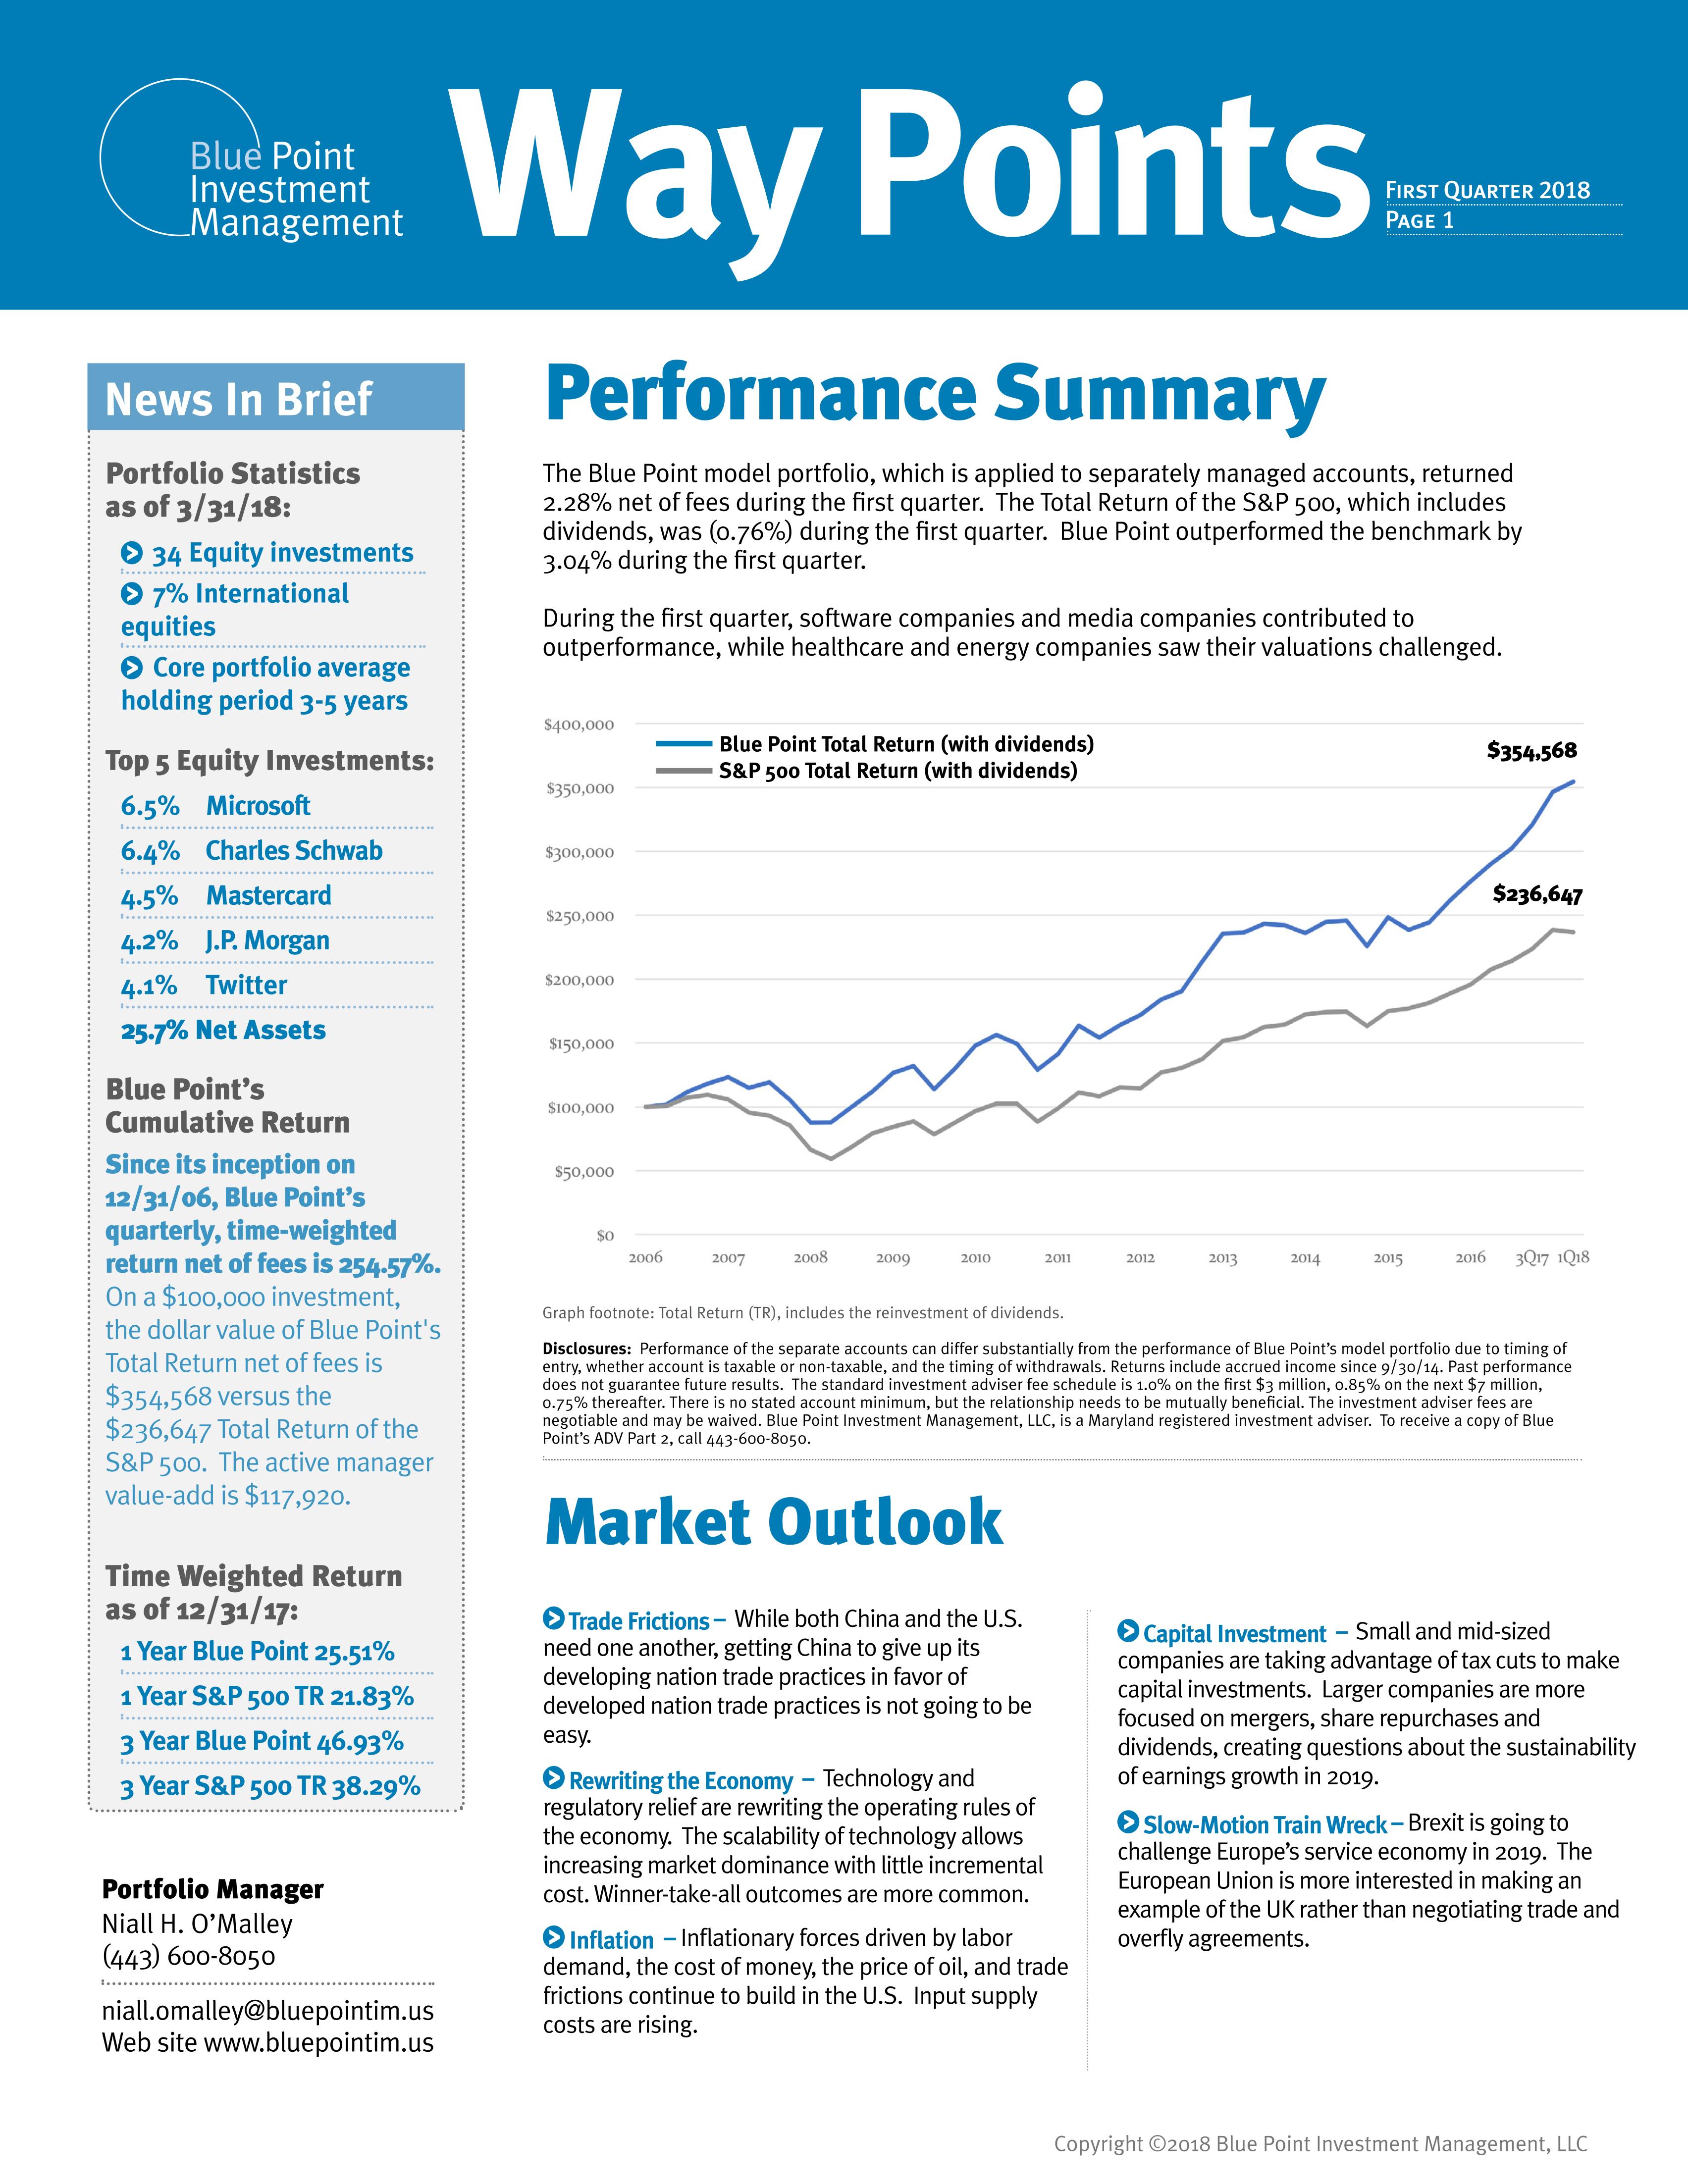
The Blue Point model portfolio, which is applied to separately managed accounts, returned 2.28% net of fees during the first quarter.
December 31, 2017
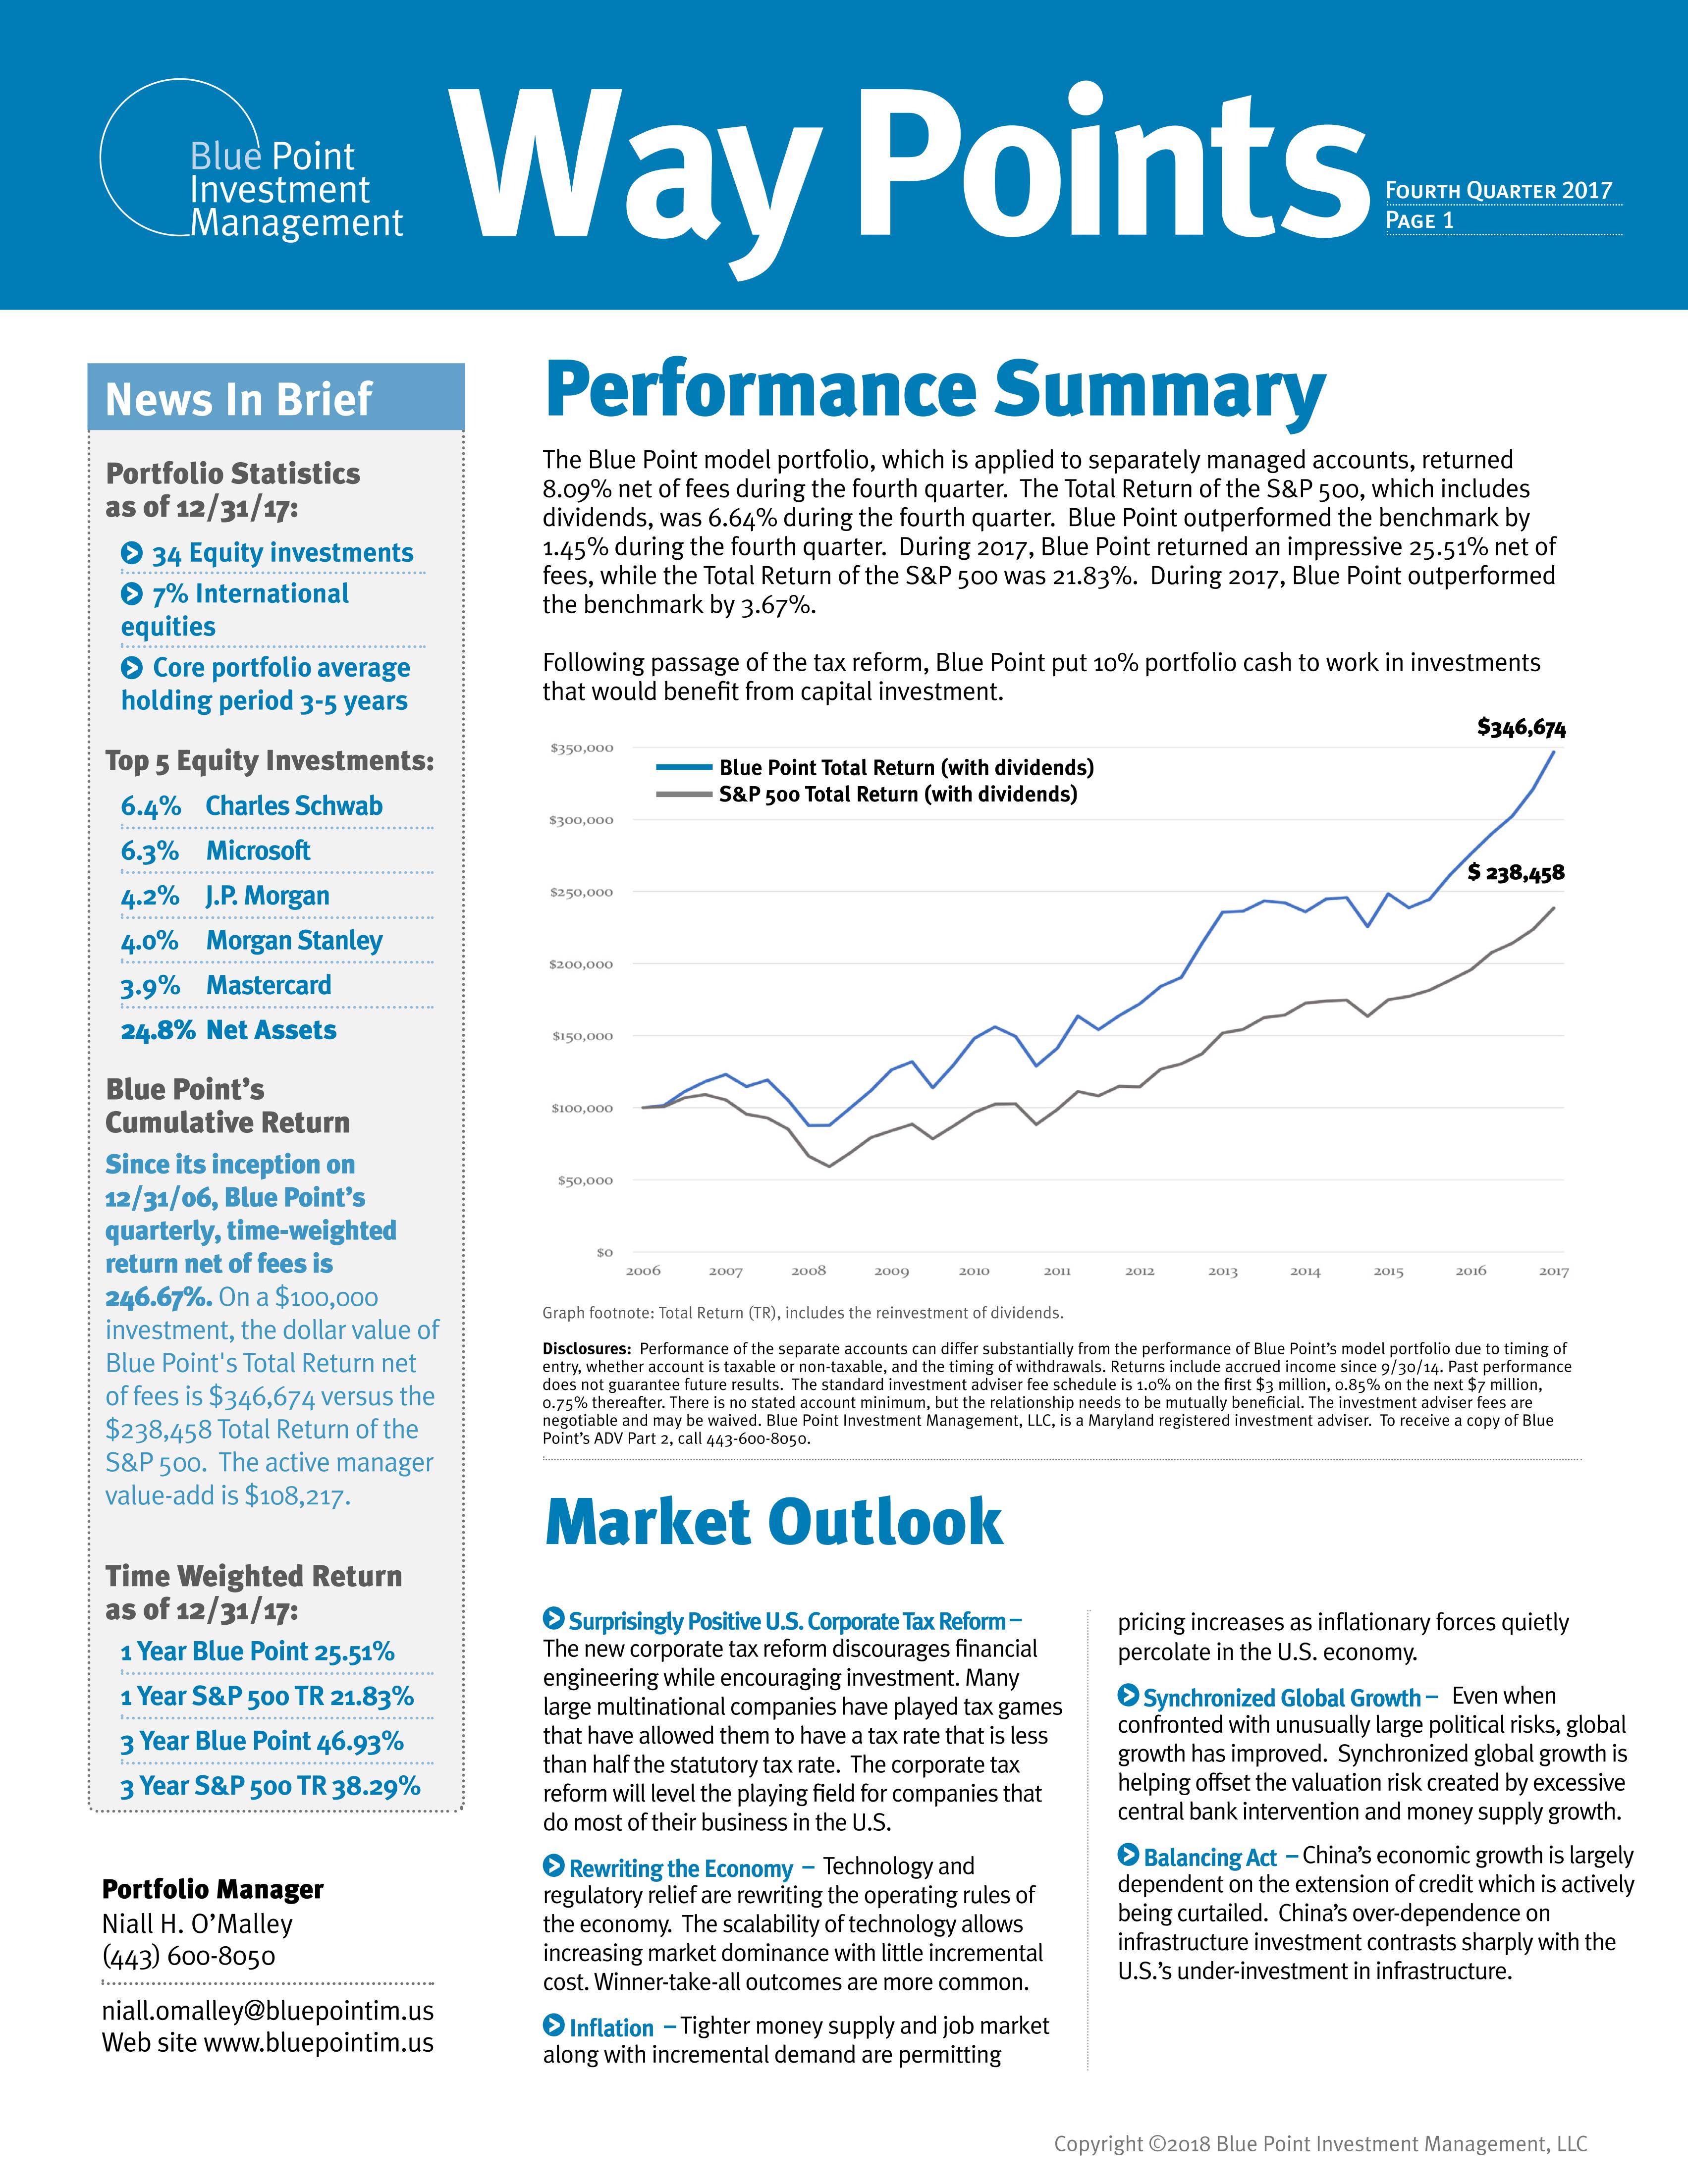
The Blue Point model portfolio, which is applied to separately managed accounts, returned 8.09% net of fees during the fourth quarter.
September 30, 2017
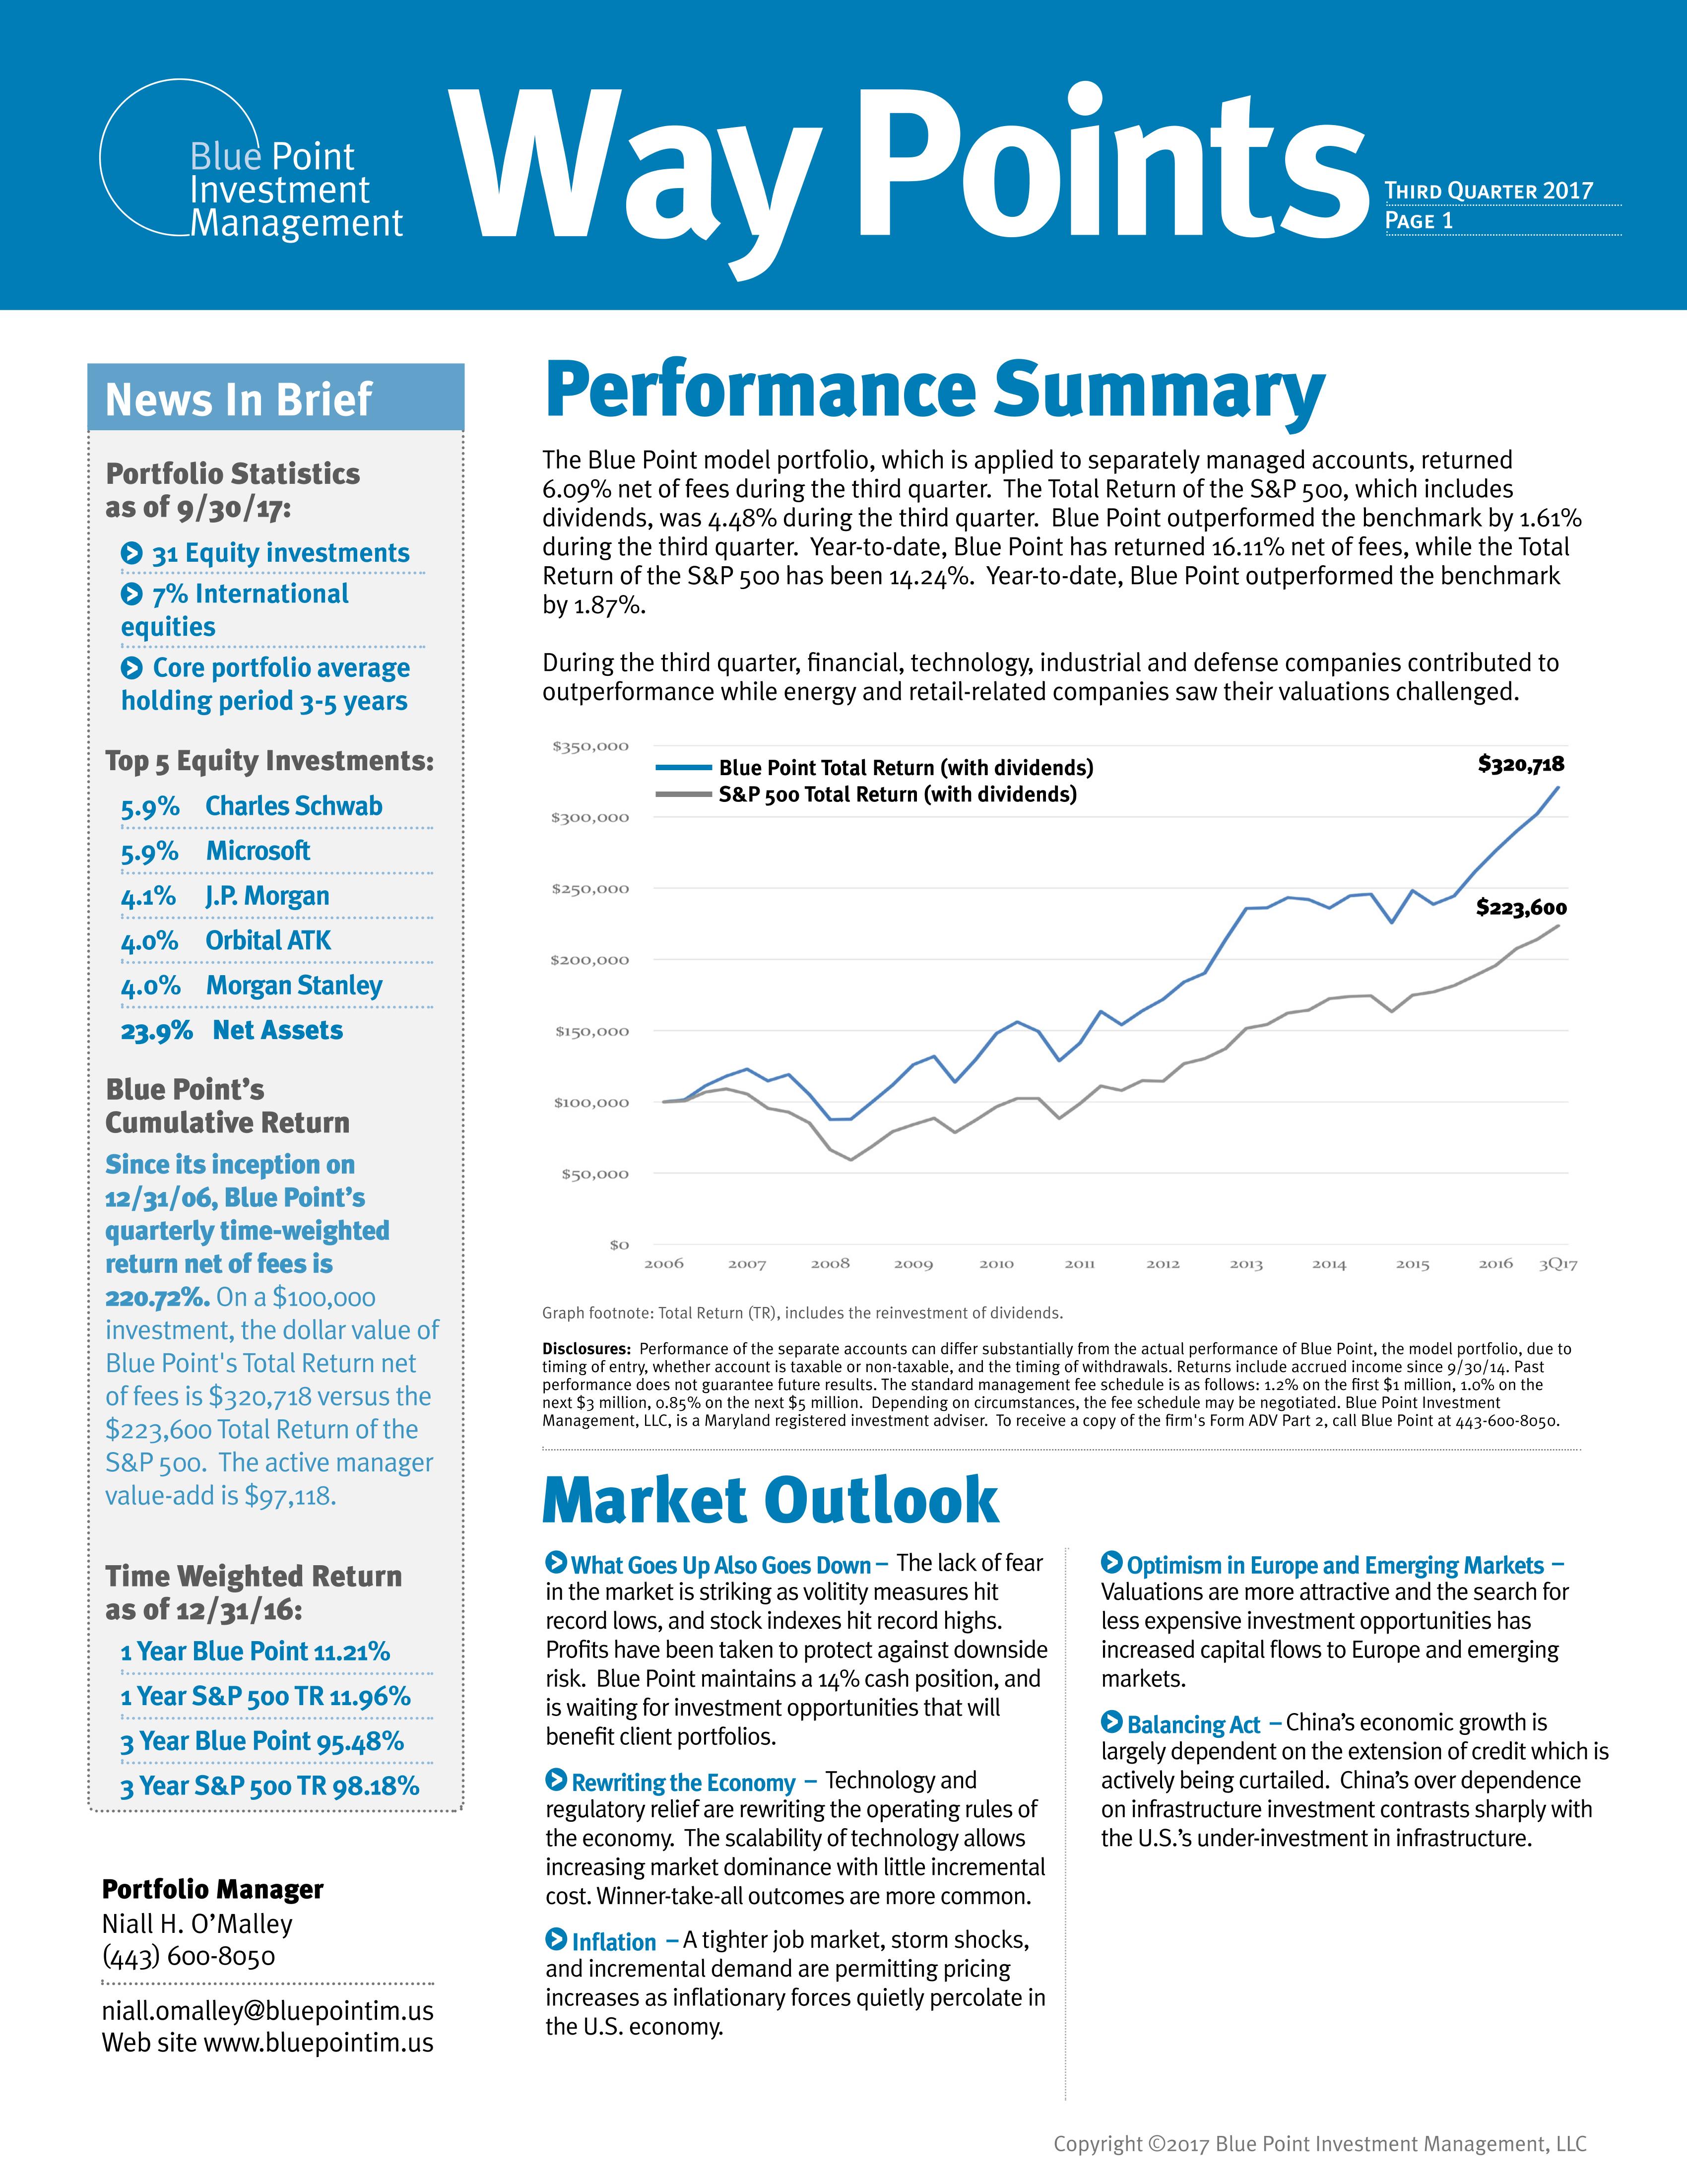
The Blue Point model portfolio, which is applied to separately managed accounts, returned 6.09% net of fees during the third quarter.
June 30, 2017
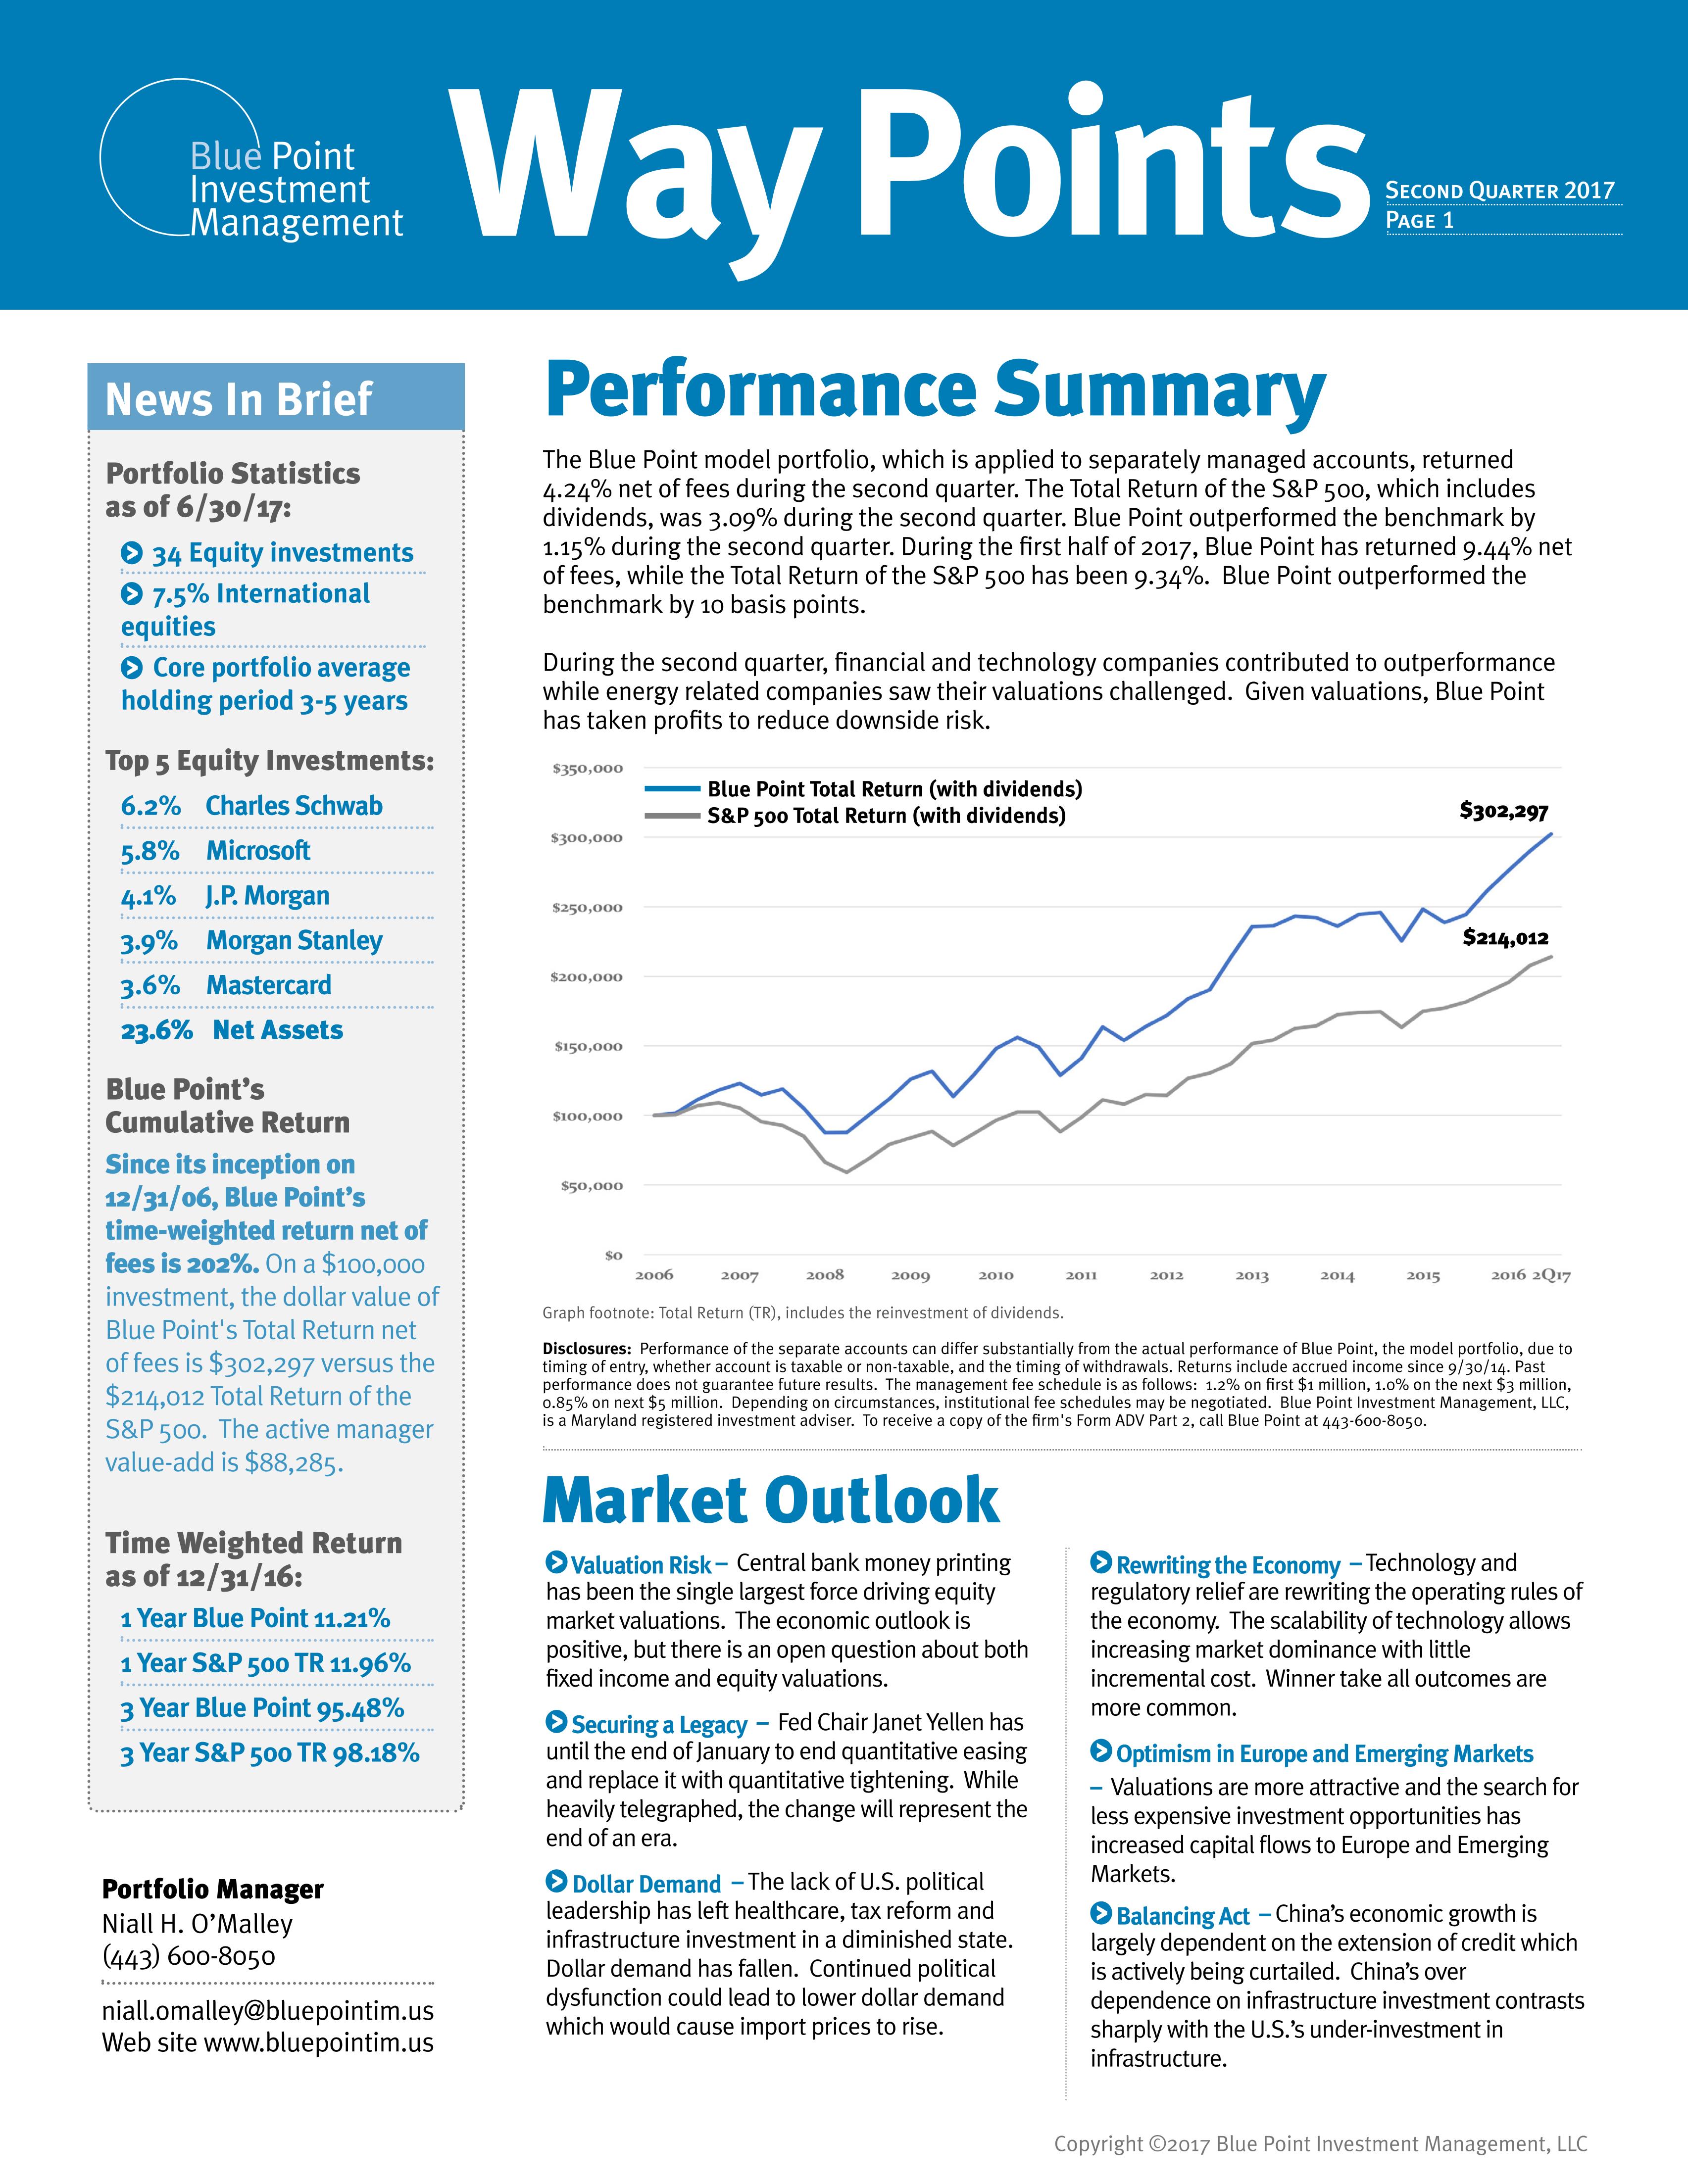
The Blue Point model portfolio, which is applied to separately managed accounts, returned 4.24% net of fees during the second quarter. The Total Return of the S&P 500, which includes dividends, was 3.09% during the second quarter.
March 31, 2017
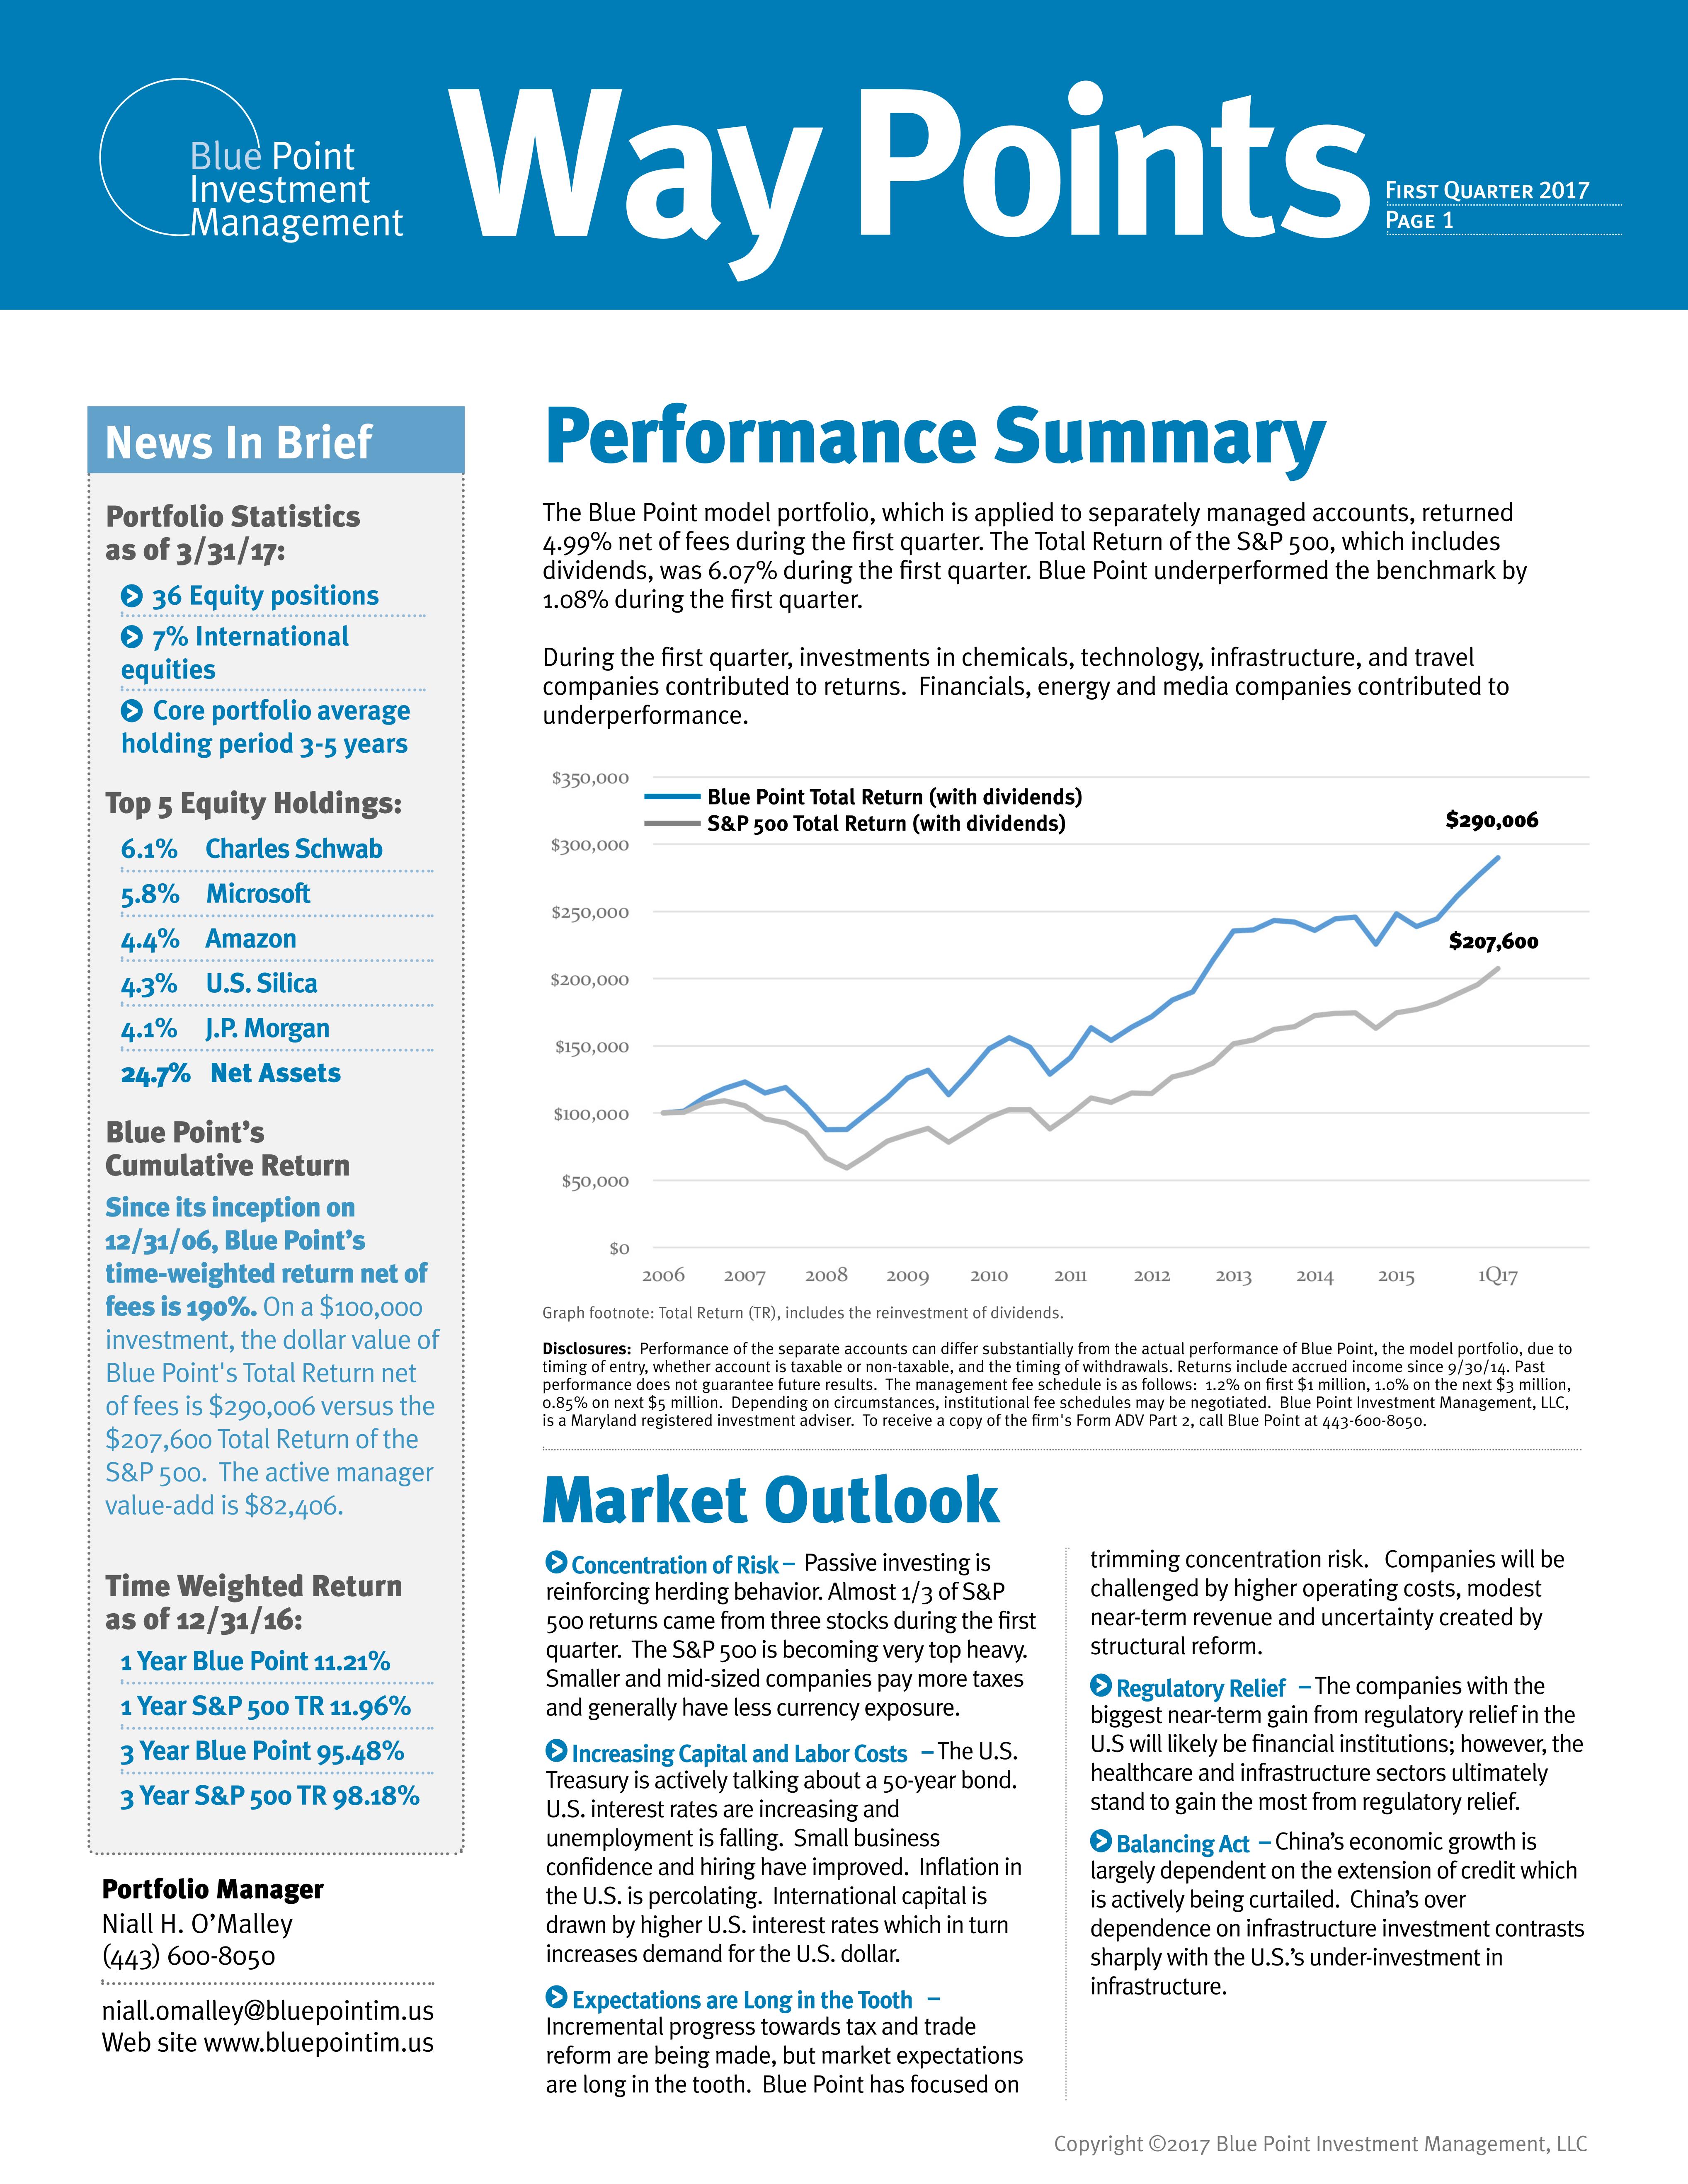
The Blue Point model portfolio, which is applied to separately managed accounts, returned 4.99% net of fees during the first quarter. The Total Return of the S&P 500, which includes dividends, was 6.07% during the first quarter. Blue Point underperformed the benchmark by 1.08% during the first quarter.
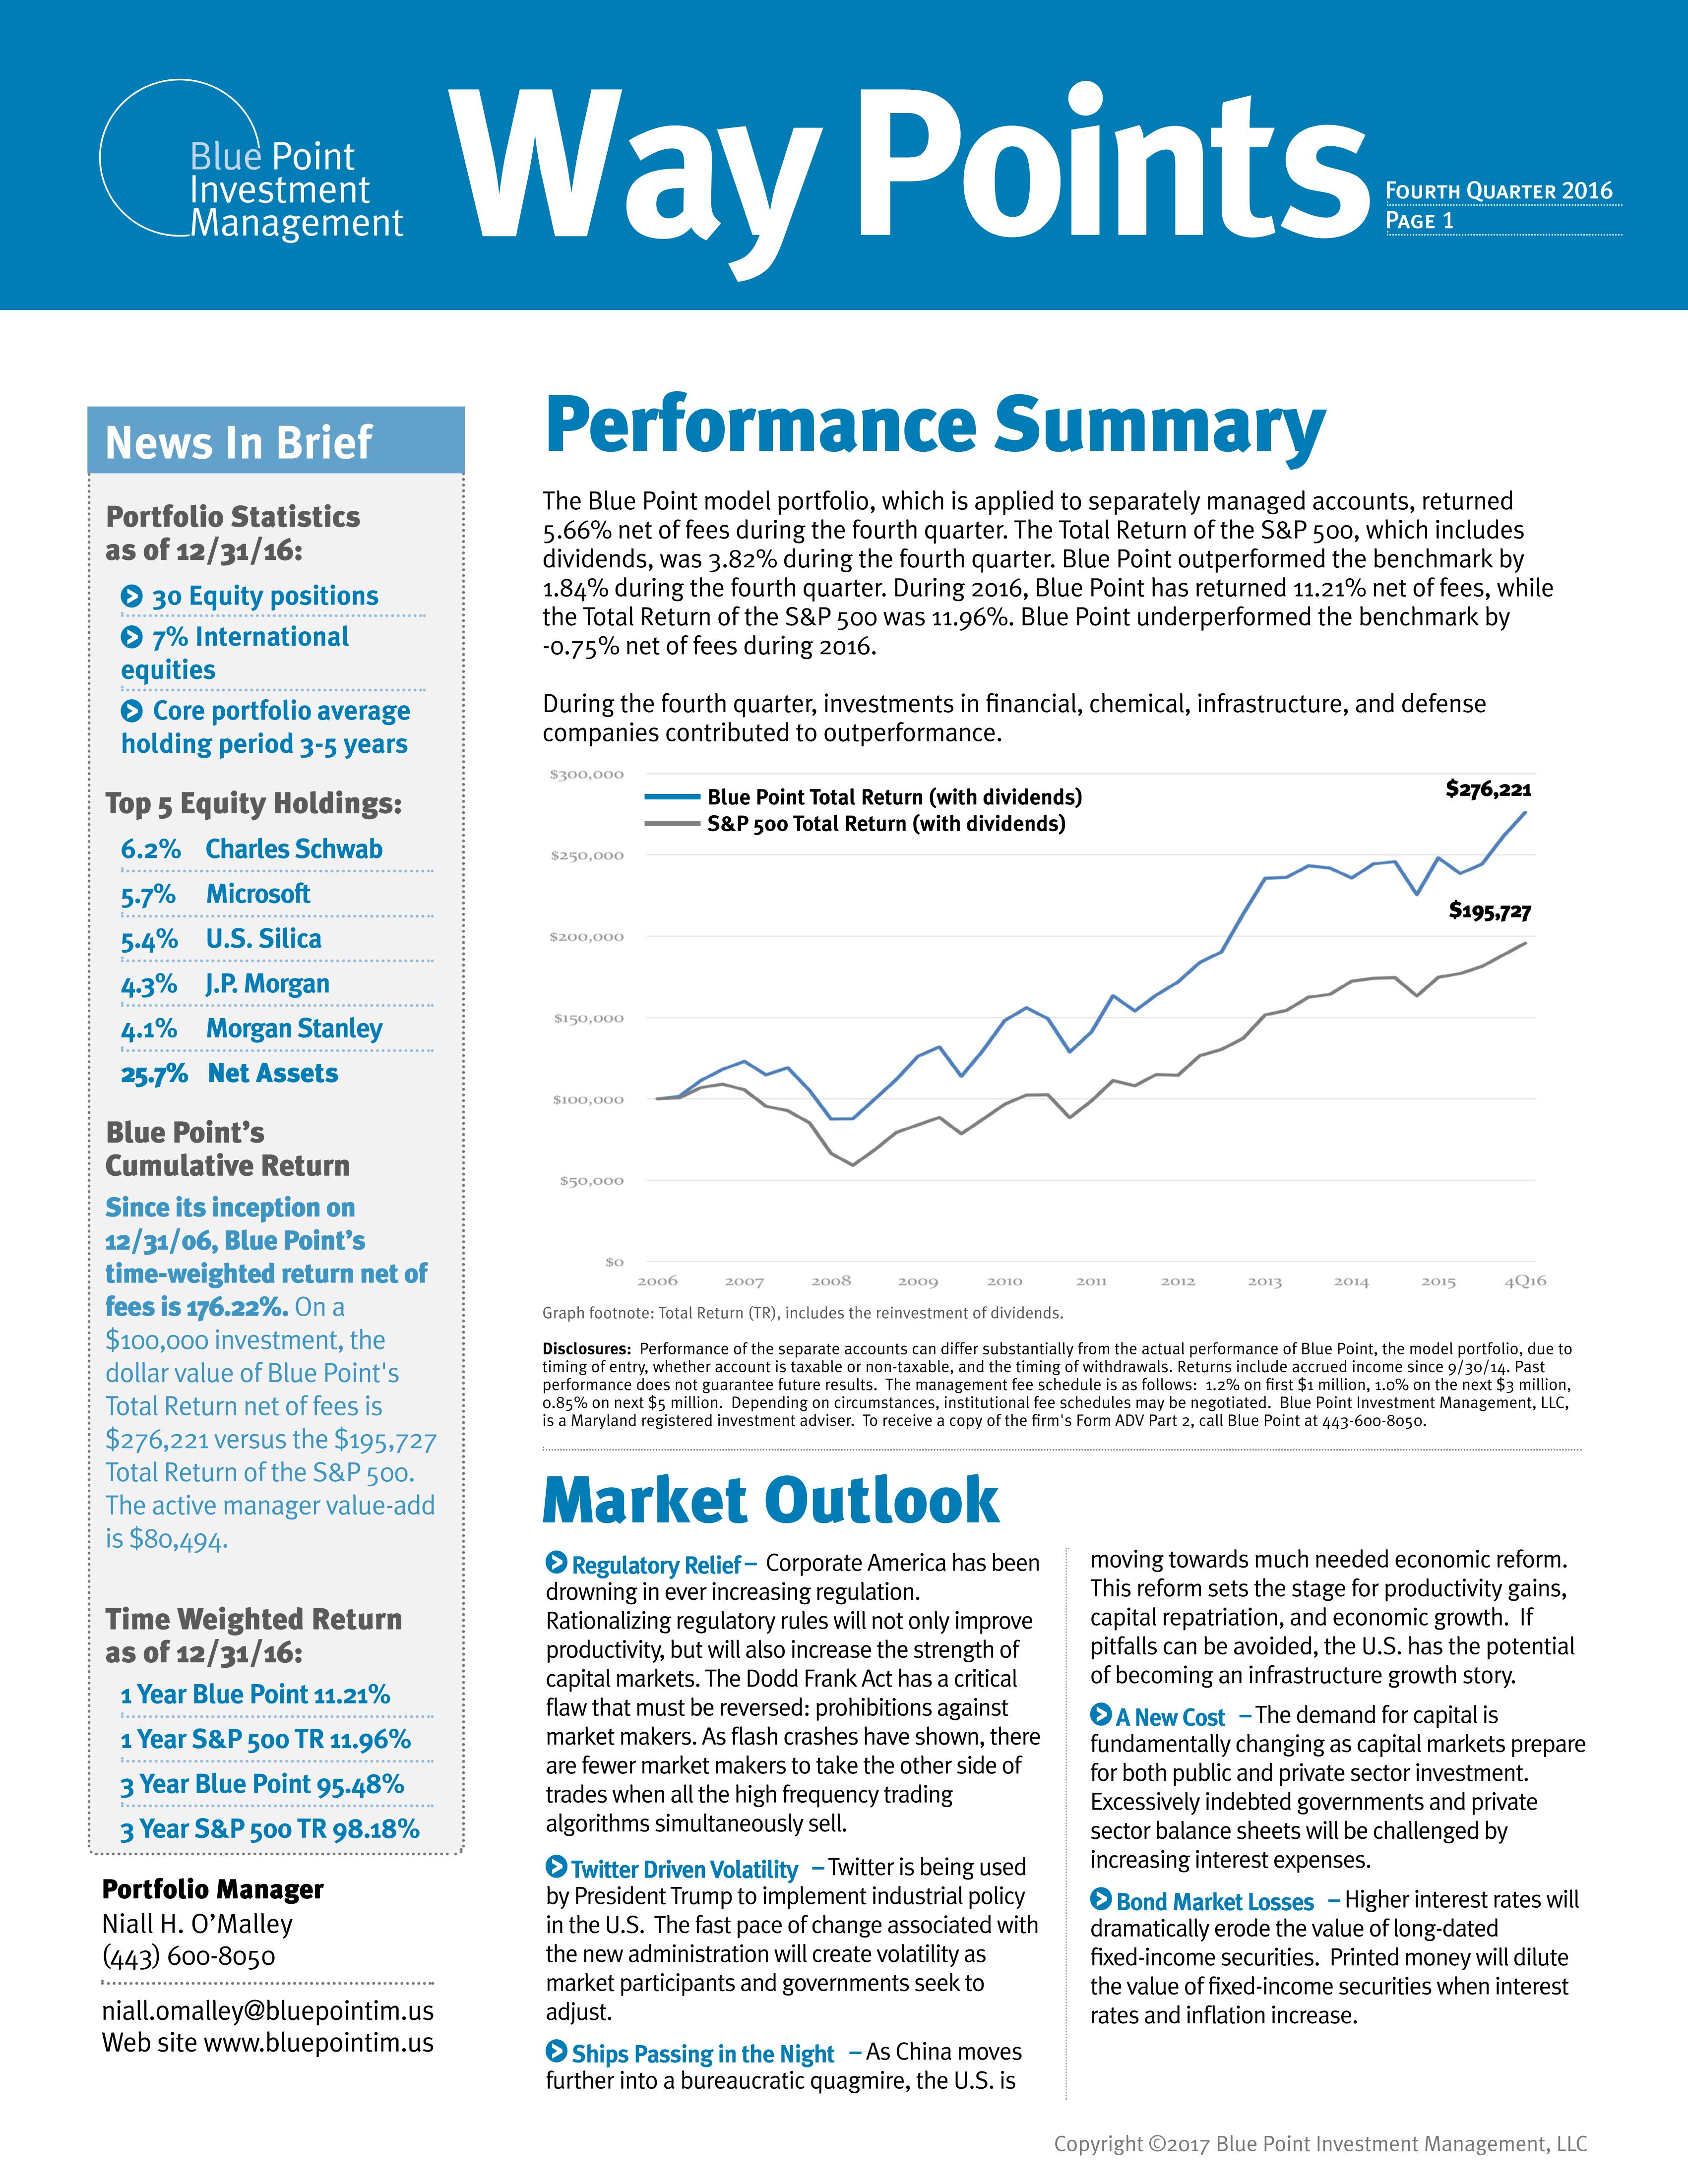
December, 2016
The Blue Point model portfolio, which is applied to separately managed accounts, returned 5.66% net of fees during the fourth quarter. The Total Return of the S&P 500, which includes dividends, was 3.82% during the fourth quarter. Blue Point outperformed the benchmark by 1.84% during the fourth quarter.
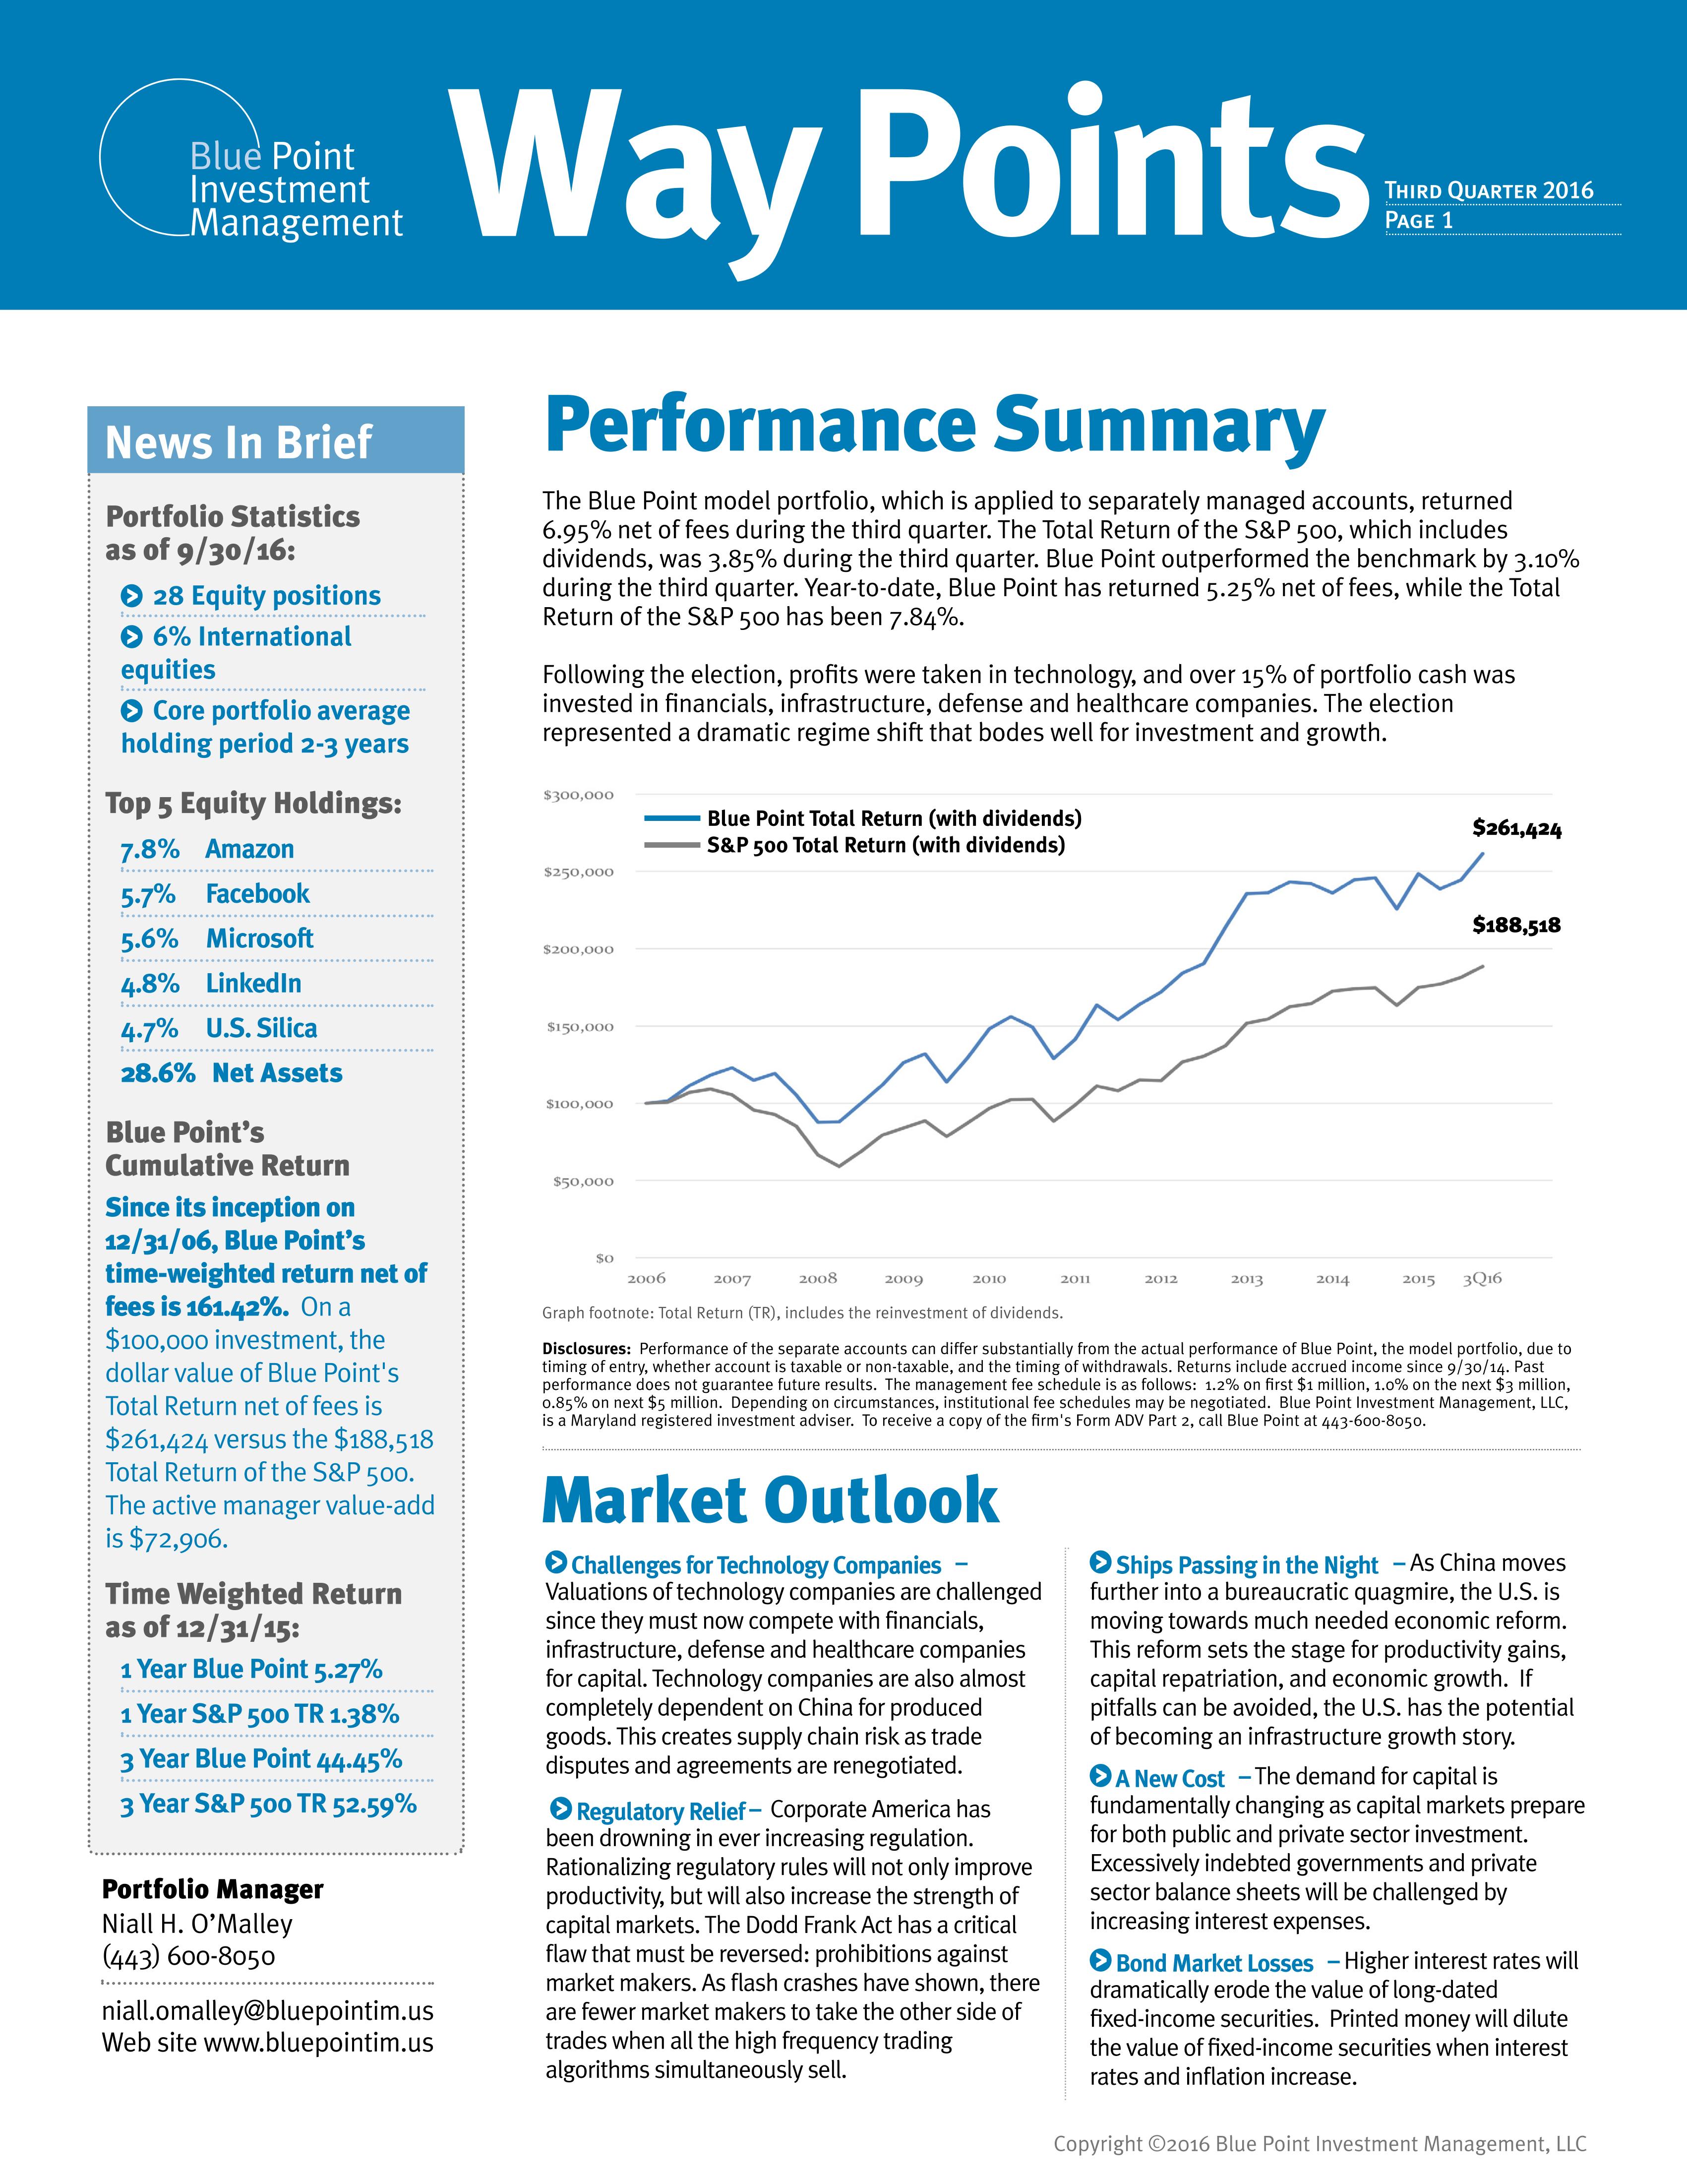
November, 2016
The Blue Point model portfolio, which is applied to separately managed accounts, returned 6.95% net of fees during the third quarter. The Total Return of the S&P 500, which includes dividends, was 3.85% during the third quarter. Blue Point outperformed the benchmark by 3.10% during the third quarter.
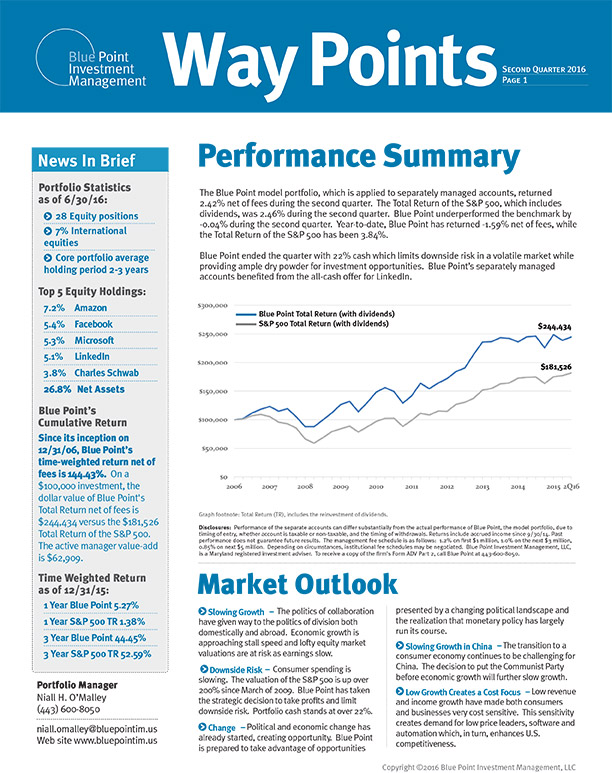
June, 2016
Blue Point ended the quarter with 22% cash which limits downside risk in a volatile market while providing ample dry powder for investment opportunities. Blue Point’s separately managed accounts benefited from the all-cash offer for LinkedIn.
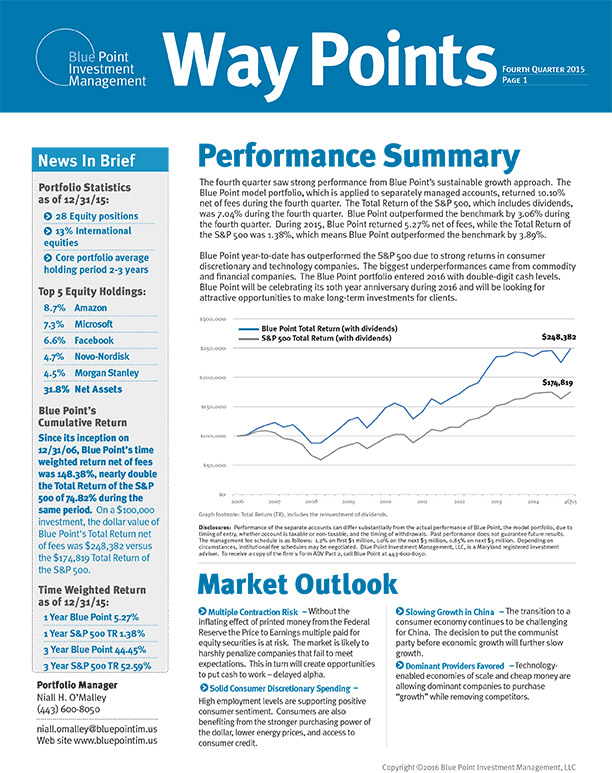
December, 2015
Blue Point outperformed the benchmark by 3.06% during the fourth quarter. During 2015, Blue Point returned 5.27% net of fees, while the Total Return of the S&P 500 was 1.38%, which means Blue Point outperformed the benchmark by 3.89%.
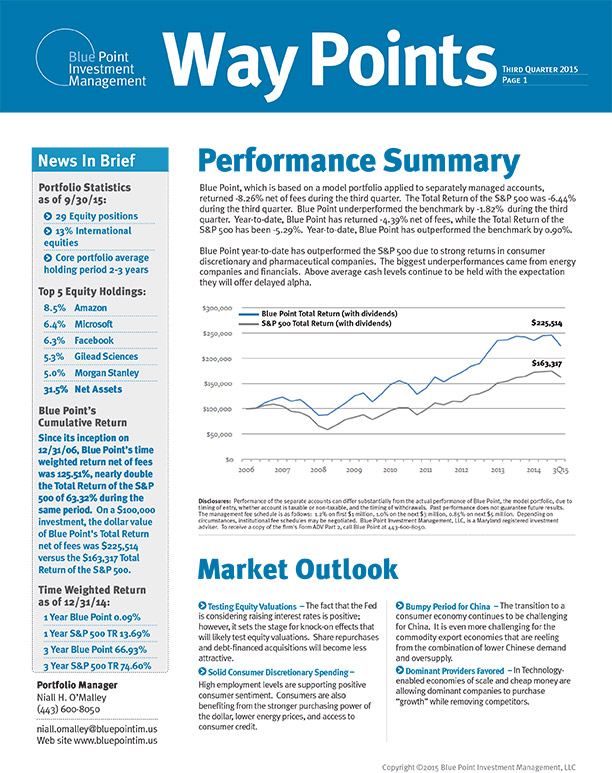
September, 2015
Blue Point year-to-date has outperformed the S&P 500 due to strong returns in consumer discretionary and pharmaceutical companies. The biggest underperformances came from energy companies and financials. Above average cash levels continue to be held with the expectation they will offer delayed alpha.
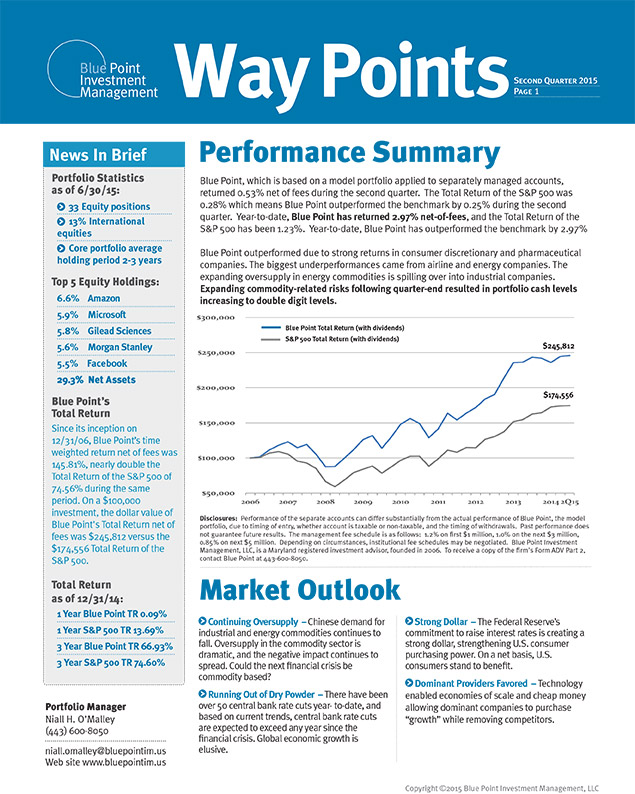
June, 2015
Blue Point, which is based on a model portfolio applied to separately managed accounts, returned 0.53% net of fees during the second quarter. The Total Return of the S&P 500 was 0.28% which means Blue Point outperformed the benchmark by 0.25% during the second
quarter.
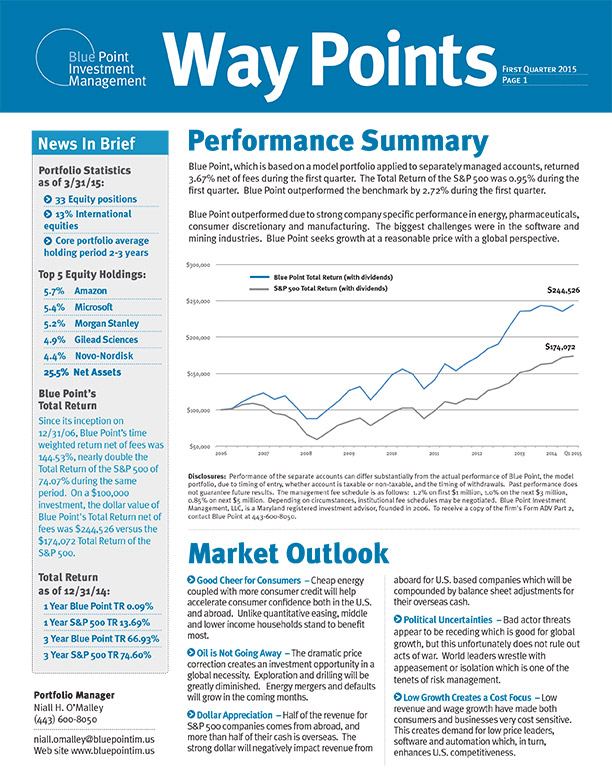
March, 2015
Blue Point, which is based on a model portfolio applied to separately managed accounts, returned 3.67% net of fees during the first quarter. The Total Return of the S&P 500 was 0.95% during the first quarter. Blue Point outperformed the benchmark by 2.72% during the first quarter.